AI-Powered Churn Analytics for 3PL Providers
3PL and freight operators often lose customers quietly — volumes drift, emails get shorter, and by the time it shows up in revenue reports it's too late. This article looks at how AI can combine service performance and communication data to flag attrition risk early and help teams prioritise retention effort.

Customer attrition is one of the quietest problems in third-party logistics. A shipper doesn't usually announce they're leaving — volumes just start trending down, emails get shorter, and by the time it shows up in the monthly revenue report, the relationship is already gone. AI-powered churn and retention analytics gives 3PL and freight operators a way to spot that drift while there's still time to act.
This is an emerging application area rather than an established category with a long track record in Australian logistics, so this article focuses on the practical mechanics — what signals matter, how AI can surface them, and how to prioritise retention effort — rather than quoting specific performance figures that don't yet exist for this use case.
What is customer churn analytics in a 3PL context?
Customer churn analytics is the practice of using operational and communication data to identify which customers are at elevated risk of reducing volume or leaving entirely, before it happens. For a 3PL, this means combining service performance data (on-time delivery, claims, exceptions) with relationship signals (email tone, response times, complaint frequency) into a single risk view per account.
Unlike a general retail churn model built on purchase frequency, a 3PL churn model has to account for contract structures, seasonal freight patterns, and the fact that a single account manager conversation can carry more weight than a dozen data points. That's why generic off-the-shelf churn tools built for SaaS or subscription businesses tend to translate poorly into freight and warehousing.
What early warning signs indicate a 3PL customer might leave?
Customer attrition in freight and 3PL relationships is rarely triggered by one incident — it's usually a pattern building across several dimensions at once. The most reliable early indicators combine service degradation with changes in how the customer engages.
- Service performance drift: rising on-time delivery misses, increasing exception or claims volume, slower resolution times on service issues.
- Volume irregularities: shipment volumes declining faster than seasonal norms, or a shift toward smaller, lower-margin jobs.
- Communication signals: shorter or more terse emails, longer gaps between customer-initiated contact, increased escalation requests, repeated questions about rates or capacity from competitors.
- Commercial signals: delayed invoice payment, renegotiation requests outside the normal contract cycle, requests for system integrations (EDI, API, real-time tracking) that go unanswered.
None of these signals is conclusive on its own. The value of AI is in correlating them across an account over time, rather than relying on an account manager to notice a pattern buried across email, the TMS, and a spreadsheet of service KPIs.
How does AI identify these signals before a customer leaves?
AI models can score customer risk by continuously analysing structured operational data (delivery performance, invoicing, claims) alongside unstructured communication data (email threads, support tickets, call notes) to flag accounts trending toward attrition. This is a natural extension of the predictive analytics capability that AI can already layer on top of legacy TMS and WMS platforms — the same underlying approach used for demand forecasting and maintenance prediction can be pointed at customer relationship data instead of fleet or warehouse data.
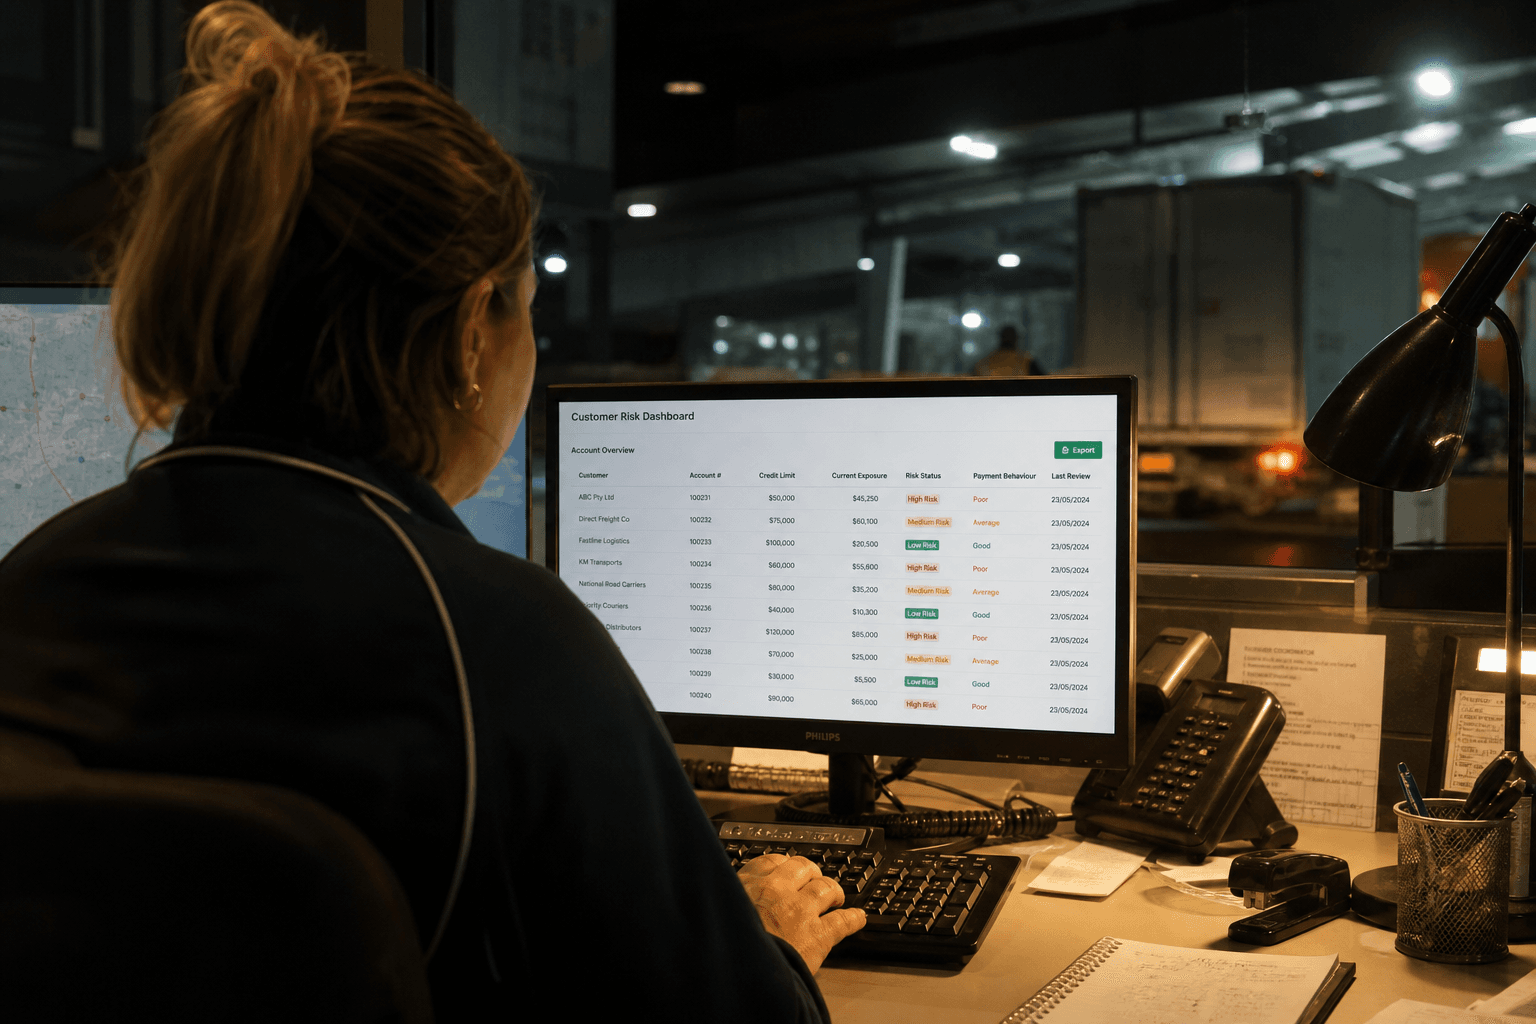
Practically, this involves three layers:
- Data consolidation — pulling service KPIs, invoicing history, and communication records into one place, since most 3PLs currently hold these in separate systems.
- Signal extraction — using document intelligence techniques to read emails, PODs, and correspondence for tone, sentiment, and recurring complaint themes that a manual review would miss at scale.
- Risk scoring — ranking accounts by combined risk, so operations and commercial teams know where to focus first.
Traditional account management vs AI-augmented retention monitoring
| Approach | How risk is identified | Coverage | Typical trigger for action | |---|---|---| | Traditional account management | Account manager judgement, quarterly business reviews | Limited to accounts an AM actively monitors | Customer complaint or visible volume drop | | Spreadsheet-based KPI tracking | Manual review of on-time delivery and claims reports | Broader but backward-looking | Monthly or quarterly reporting cycle | | AI-augmented retention monitoring | Continuous scoring across service, commercial, and communication data | All accounts, updated continuously | Risk score crosses a defined threshold |
The table above reflects qualitative differences in coverage and timing rather than measured performance gains, since results depend heavily on data quality and how well a model is tuned to a specific operation.
How should a 3PL prioritise retention effort once risk is identified?
Not every at-risk account deserves the same response — prioritisation should weigh account value, contract term remaining, and the specific cause of risk. An account with declining on-time performance and six months left on contract needs a different response to one showing communication drop-off with two years remaining.

A practical prioritisation framework typically considers:
- Revenue and margin contribution — protect the accounts that matter most to the business first.
- Root cause — a service failure needs an operational fix; a communication gap needs account management attention; a rate-shopping signal needs a commercial conversation.
- Time sensitivity — accounts nearing contract renewal or tender renewal windows should be triaged ahead of others.
- Feasibility of fix — some churn drivers (a competitor's lower rate) are harder to address than others (a recurring documentation error causing delivery delays).
This is where churn analytics connects to other AI investments a 3PL might already be exploring. Service performance issues often trace back to the same operational bottlenecks that route optimisation is designed to address, and documentation-related complaints frequently point to gaps that document intelligence tools can close.
Does this require a dedicated data science team?
No — most mid-market 3PLs don't need an in-house data science function to get started with churn analytics. The initial requirement is usually data consolidation and a clear view of what's already being captured in the TMS, CRM, and email systems, which is exactly the kind of gap an external AI partner can assess and scope before any model is built.
Given that this is a newer application for 3PLs specifically, the sensible starting point is an assessment of what data actually exists and how reliable it is, rather than jumping straight into a churn model. That's the kind of scoping work covered in an AI Readiness Assessment — identifying where operational and communication data already lives, how clean it is, and whether a retention risk model is realistic before committing budget to build one.
For more on how AI is being applied across freight, warehousing, and compliance in Australia, see our insights.
If you're exploring how AI could help your business spot at-risk customer relationships earlier, we can help scope what's realistic given your current systems and data.
Zero Footprint
The Zero Footprint team — AI modernisation for Australian logistics.