AI Churn Analytics for 3PL Providers in Australia
AI-powered churn analytics helps 3PLs spot at-risk customer accounts before volume quietly erodes, by combining service data with communication signals most TMS and WMS platforms already hold. This guide explains how the approach works, what signals matter most, and how it fits alongside other AI priorities like route optimisation and emissions reporting.
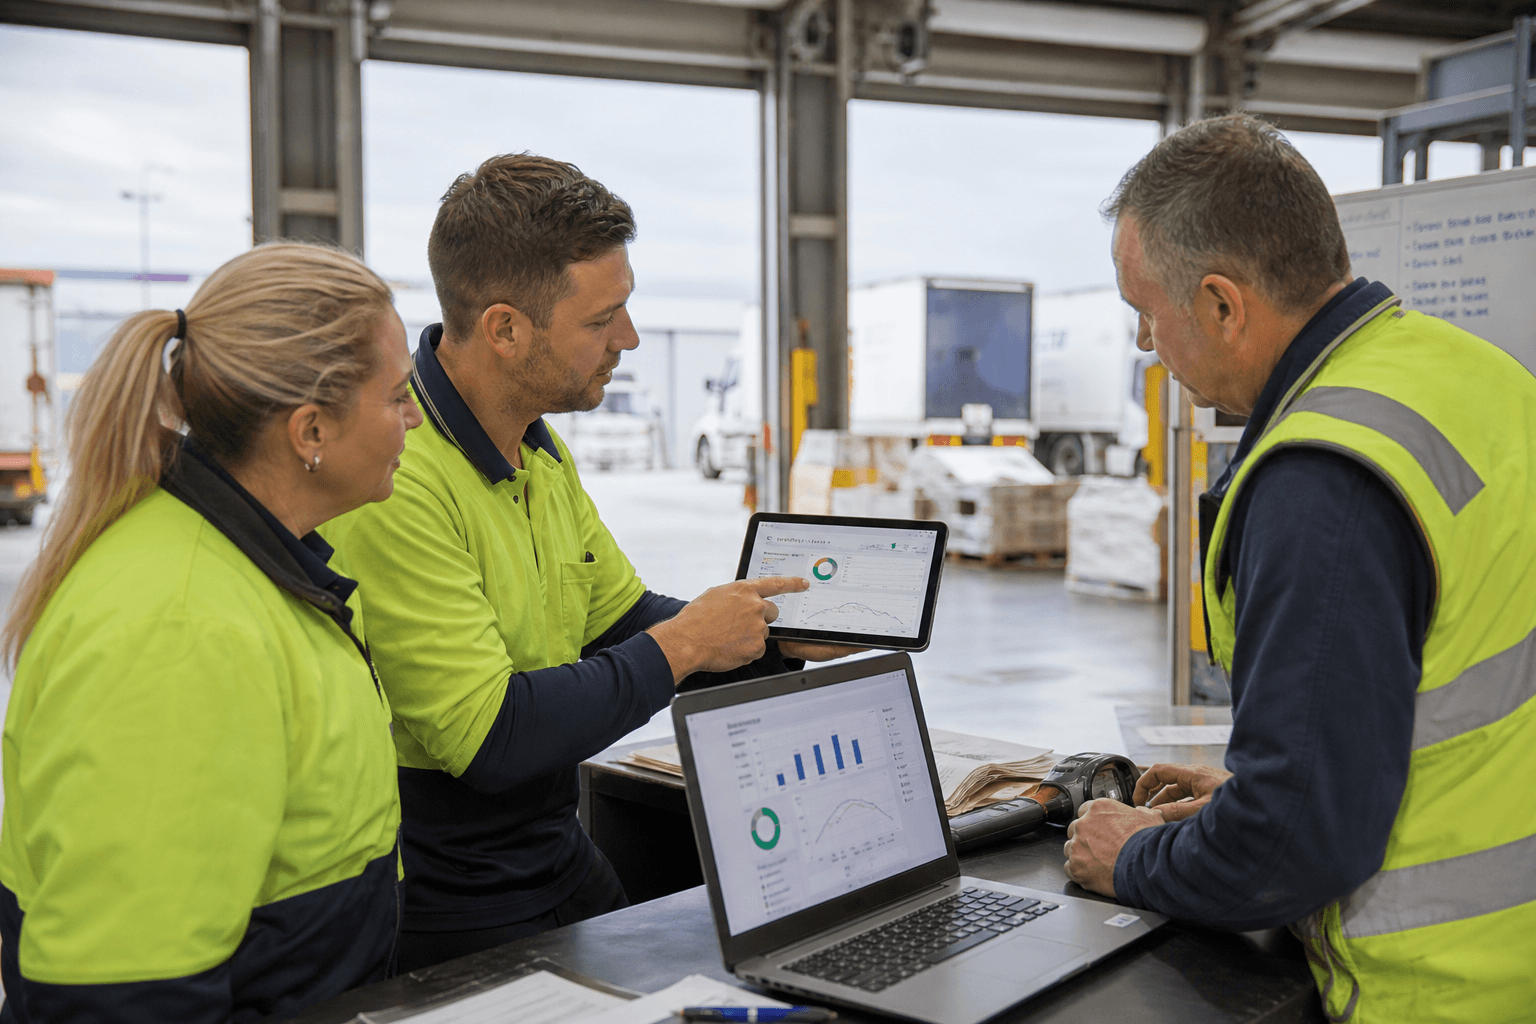
AI-powered churn analytics uses a combination of operational data (on-time performance, damage rates, invoice accuracy) and relationship signals (email sentiment, complaint frequency, response times) to flag which 3PL accounts are at risk of reducing volume or not renewing — before the drop-off shows up in the numbers. It's a form of predictive analytics applied to customer retention rather than fleet or warehouse operations, and for freight and 3PL operators already exploring AI in logistics, it's a natural extension of capability many are building anyway.
This is an emerging application area rather than an off-the-shelf category. Most Australian 3PLs don't yet have a dedicated churn model, and there's no single industry benchmark to point to. What follows is a practical look at how the underlying approach works and where it fits alongside the AI investments 3PLs are already making — including route optimisation and emissions reporting, which typically sit on the same underlying data infrastructure.
What Is Customer Churn Analytics for a 3PL?
Customer churn analytics is the practice of using historical and real-time data to identify customers who are at elevated risk of reducing volume, switching providers, or not renewing a contract. In a 3PL context, this means combining operational data with relationship signals to flag accounts that need attention before they leave.
Unlike subscription businesses, 3PLs don't get a clean "cancel" event — attrition shows up gradually as volume erosion, shorter contract renewals, or a customer quietly diverting freight to a competitor. That makes early detection harder, but also more valuable, because a gradual decline gives operations teams a window to intervene.
Why Do 3PL Customers Actually Leave?
Customers typically leave 3PLs for a mix of service failures and relationship breakdowns, not price alone. Missed delivery windows, recurring claims, poor visibility into shipment status, and slow or inconsistent communication are the drivers that show up most often in industry commentary on freight and logistics customer relationships.

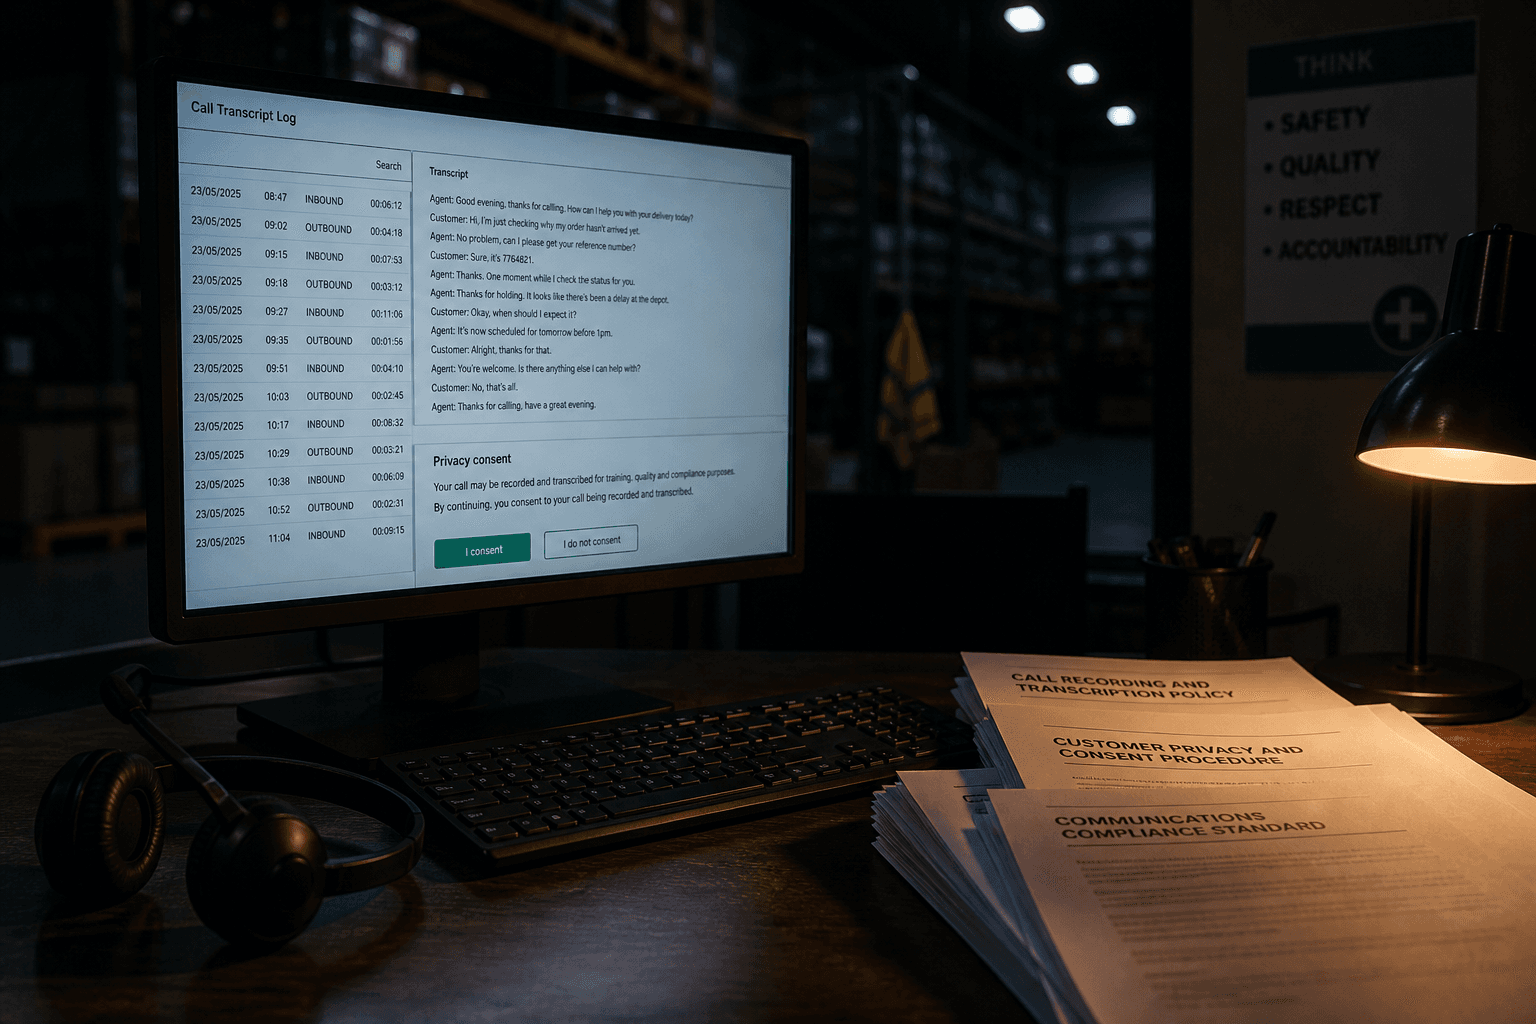
For operations leaders running the account day-to-day, this usually feels like a slow accumulation of small frustrations rather than one dramatic failure. That's precisely why manual account reviews — a quarterly business review deck, a gut-feel check-in — tend to miss the pattern until it's too late. The data to catch it earlier already exists inside most TMS and WMS platforms and inboxes; it's just not being analysed systematically.
What Early Warning Signals Can AI Actually Detect?
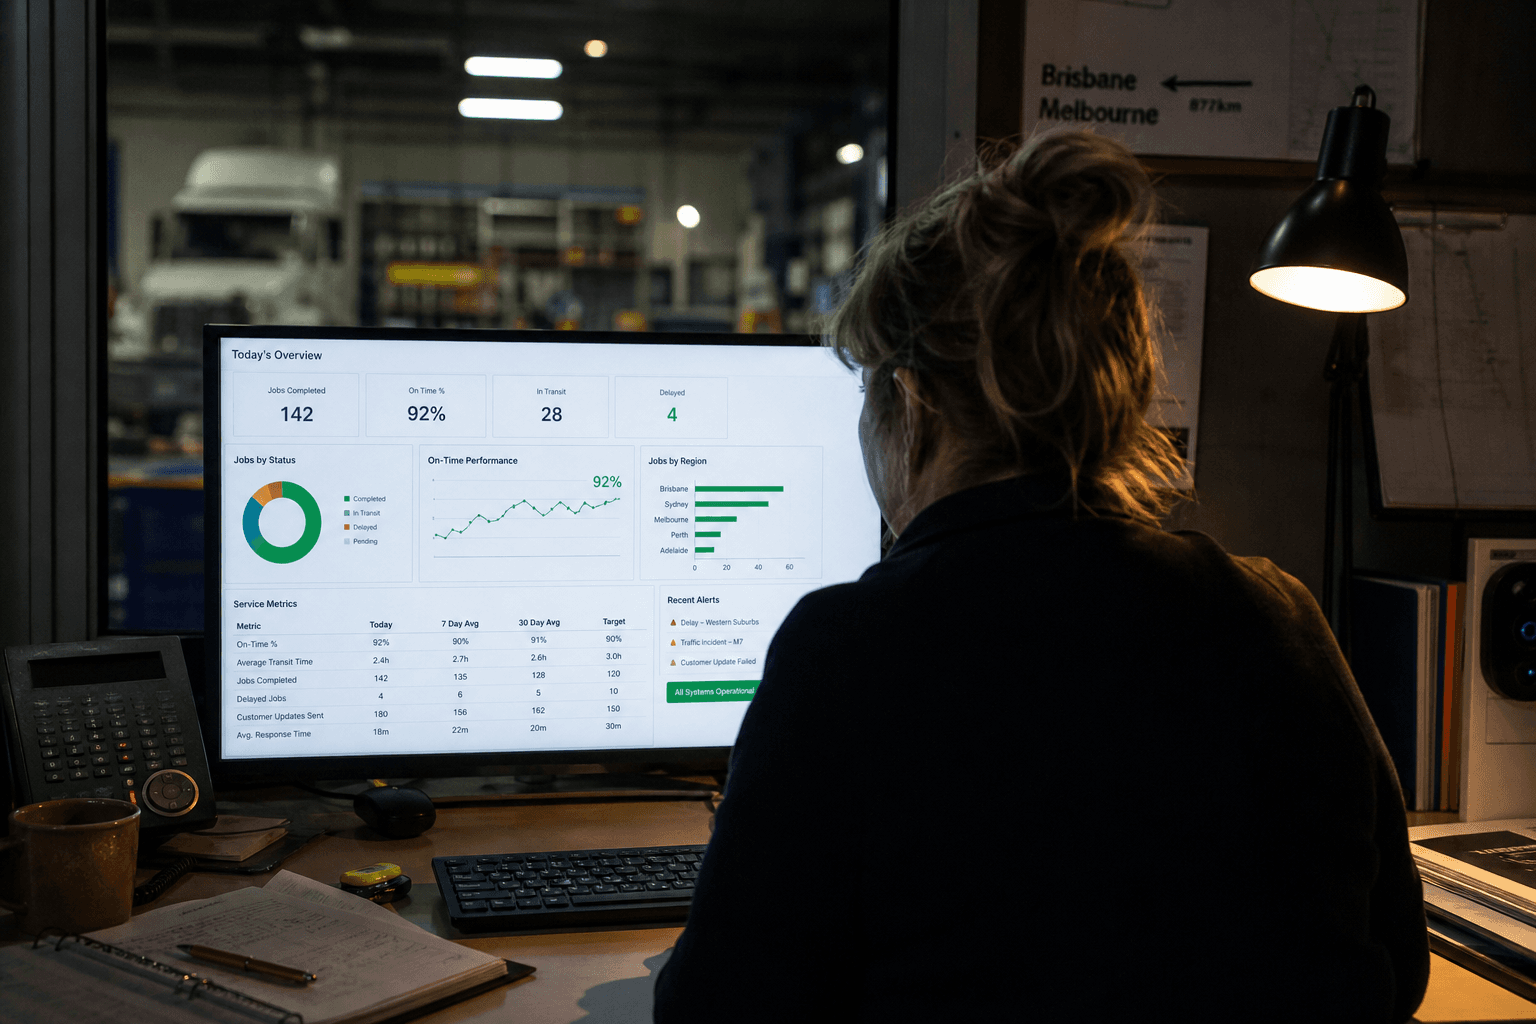
AI models built for retention risk typically combine service-level data with unstructured communication data, because neither signal alone tells the full story. Service metrics show what happened; communication data shows how the customer felt about it.
| Signal category | What it captures | Why it matters for retention |
|---|---|---|
| Service performance | On-time delivery, dwell time, damage/claims rate | Direct measure of contracted SLA delivery |
| Invoice and billing | Dispute frequency, credit note volume, payment delays | Often an early proxy for dissatisfaction before a customer raises it verbally |
| Communication tone and volume | Sentiment in emails/tickets, escalation frequency, response lag | Captures relationship strain that service metrics alone miss |
| Volume trend | Shipment count, lane mix change, seasonal deviation from forecast | Quiet volume erosion is often the first hard evidence of switching |
| Engagement cadence | Frequency of account reviews, responsiveness to outreach | Disengagement from the relationship itself is a leading indicator |
No single row in that table is a reliable predictor on its own. The value of an AI-based approach is in weighting and combining these signals consistently across every account, rather than relying on whichever account manager happens to notice something.
How Does This Connect to Existing TMS and WMS Data?
The good news for most mid-market 3PLs is that this doesn't require a new platform — it requires getting more value out of data that's already sitting in legacy systems. AI can be layered on top of existing TMS/WMS platforms to extract structured and unstructured data for predictive analytics, without a full system replacement. That's the same principle that underpins other applications 3PLs are investing in, from route optimisation for freight networks to emissions reporting for AASB S2 and Scope 3 obligations — all draw on the same underlying operational data, just modelled for a different question.
For churn analytics specifically, that usually means pulling service-level metrics out of the TMS, pairing them with communication records from email or ticketing systems, and feeding both into a model that scores account risk. Where communication data is unstructured — long email chains, PDF correspondence, scanned complaint forms — document intelligence tooling is often the missing piece that makes this kind of analysis practical rather than a manual research project.
How Should Operators Prioritise Retention Effort?
Not every at-risk account deserves the same response, and this is where AI adds the most practical value: ranking accounts by a combination of risk and revenue impact, so limited account management time goes where it matters most. A large account with a moderate risk score often warrants faster intervention than a small account with a high one.
A sensible prioritisation approach weights three things: the size of the account (revenue or volume at stake), the confidence of the risk score (how many independent signals are pointing the same direction), and the time window available to act (a gradual volume decline gives more room to respond than a sudden escalation or a formal complaint). Getting this right doesn't require a perfect model on day one — it requires a model that's consistently applied, reviewed, and refined as more account outcomes feed back into it.
For 3PLs and freight operators considering this kind of capability, the starting point isn't usually a churn model in isolation. It's an honest look at what data already exists across TMS, WMS, billing, and communication systems, and where the highest-value AI application sits — retention risk, route efficiency, emissions reporting, or warehouse throughput. An ai readiness assessment is designed to answer that question before any build work starts, so investment goes toward the problem that matters most for your operation rather than whichever application is easiest to build first.
If you're weighing up where churn and retention analytics fits against other AI priorities in your business, get in touch — or browse more insights on how mid-market logistics operators are approaching AI adoption.
Zero Footprint
The Zero Footprint team — AI modernisation for Australian logistics.