How to Automate Emissions Tracking for Fleet and Subcontractors
Manually tracking emissions across your fleet and subcontractors doesn't scale. Here's how to build automated pipelines that pull data from GPS, fuel cards, and TMS — and produce audit-ready reports.

The Spreadsheet Problem
Most logistics companies start emissions tracking the same way: a spreadsheet. Someone in finance or compliance pulls fuel card statements, estimates kilometres from delivery records, and applies emission factors from a PDF they found on the Clean Energy Regulator's website.

It works for the first report. It breaks by the third.
The problems compound: fuel cards don't match GPS data, subcontractors report quarterly (if at all), emission factors change, and nobody can reproduce last year's numbers because the person who built the spreadsheet left.
What an Automated Pipeline Looks Like
An automated emissions tracking system has four layers:
1. Data Ingestion
Connect to the systems you already run:
- Fleet telematics/GPS: Real-time vehicle location, distance, idle time, fuel consumption (for vehicles with CAN bus integration)
- Fuel cards: Transaction-level data — litres, fuel type, location, vehicle ID
- TMS: Consignment records, carrier assignments, delivery confirmations
- Subcontractor portals: Self-reported data via API or structured file upload
Most of these systems have APIs. Some have SFTP exports. A few require database views or screen scraping. The point is: the data exists. It just isn't connected.
2. Calculation Engine
Raw data goes in, emissions come out. The engine applies:
- NGER emission factors for Australian-specific calculations
- GHG Protocol methodologies for Scope 3 categories
- Activity-based calculations where data quality supports it (fuel-based for own fleet, distance-based for subcontractors)
- Fallback factors where primary data isn't available (spend-based as last resort)
The calculation engine should version its factors. When the Clean Energy Regulator updates emission factors annually, you update the config — not the spreadsheet formulas.
3. Data Quality Layer
This is where most implementations fall short. Raw data is messy:
- Fuel card transactions with missing vehicle IDs
- GPS gaps from poor cellular coverage in regional areas
- Duplicate consignment records from TMS data entry errors
- Subcontractor data in inconsistent formats
Build validation rules: flag anomalies, reconcile fuel card purchases against GPS-derived consumption, and create a confidence score for each data point. Auditors will ask about data quality. Have an answer.
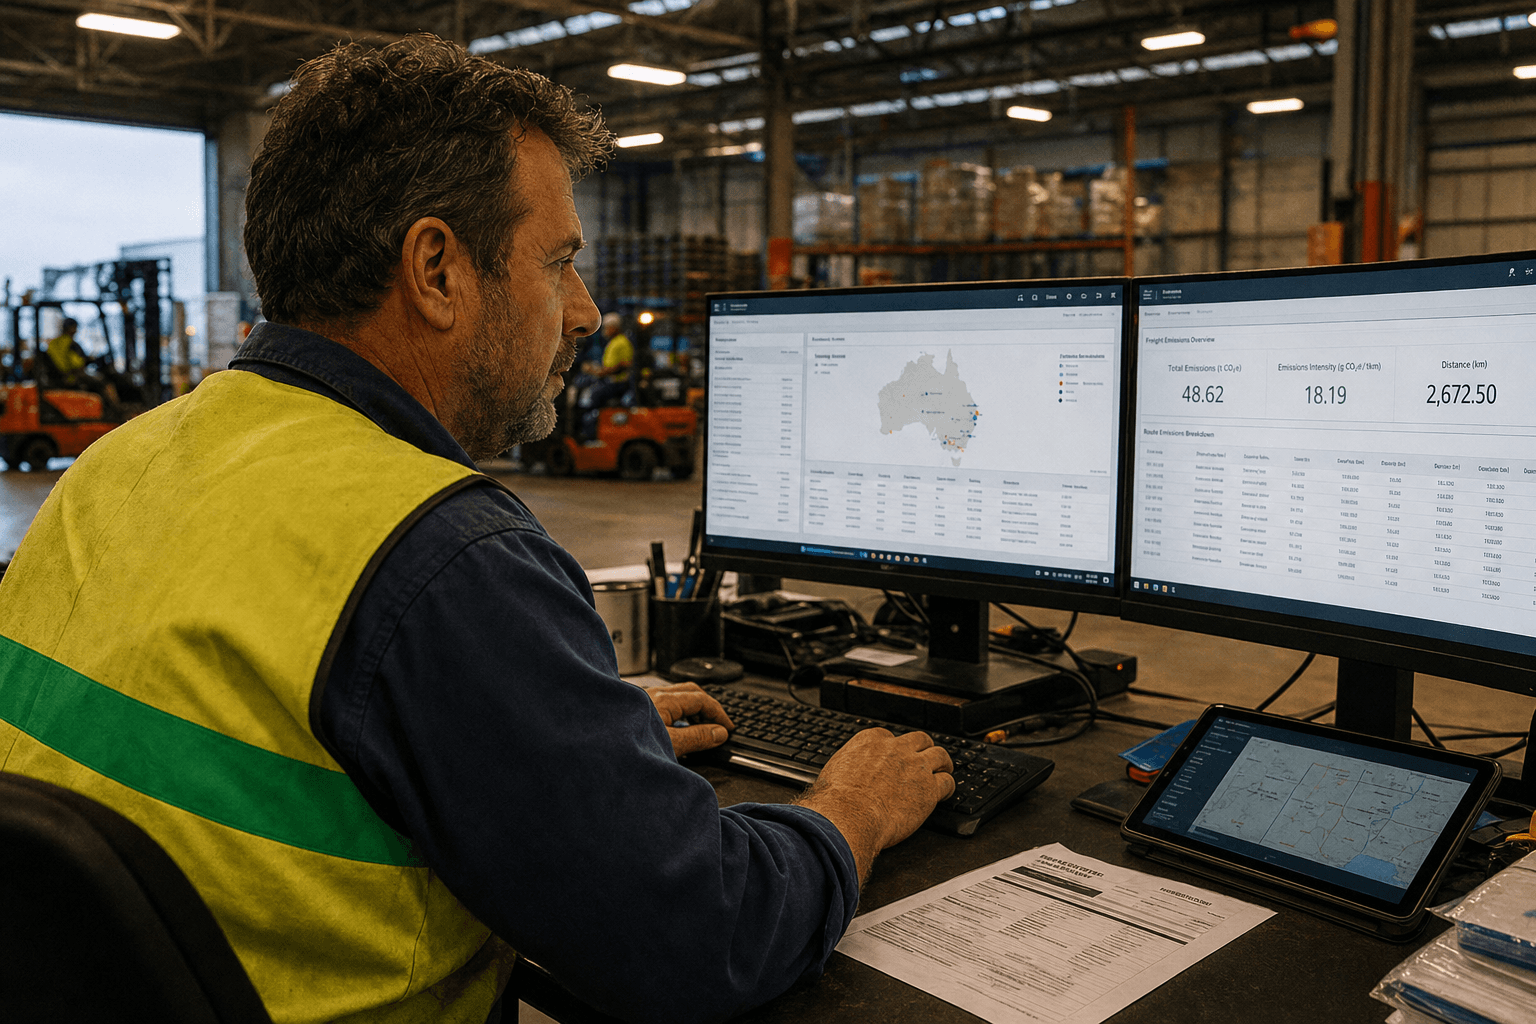
4. Reporting and API Layer
Two outputs matter:
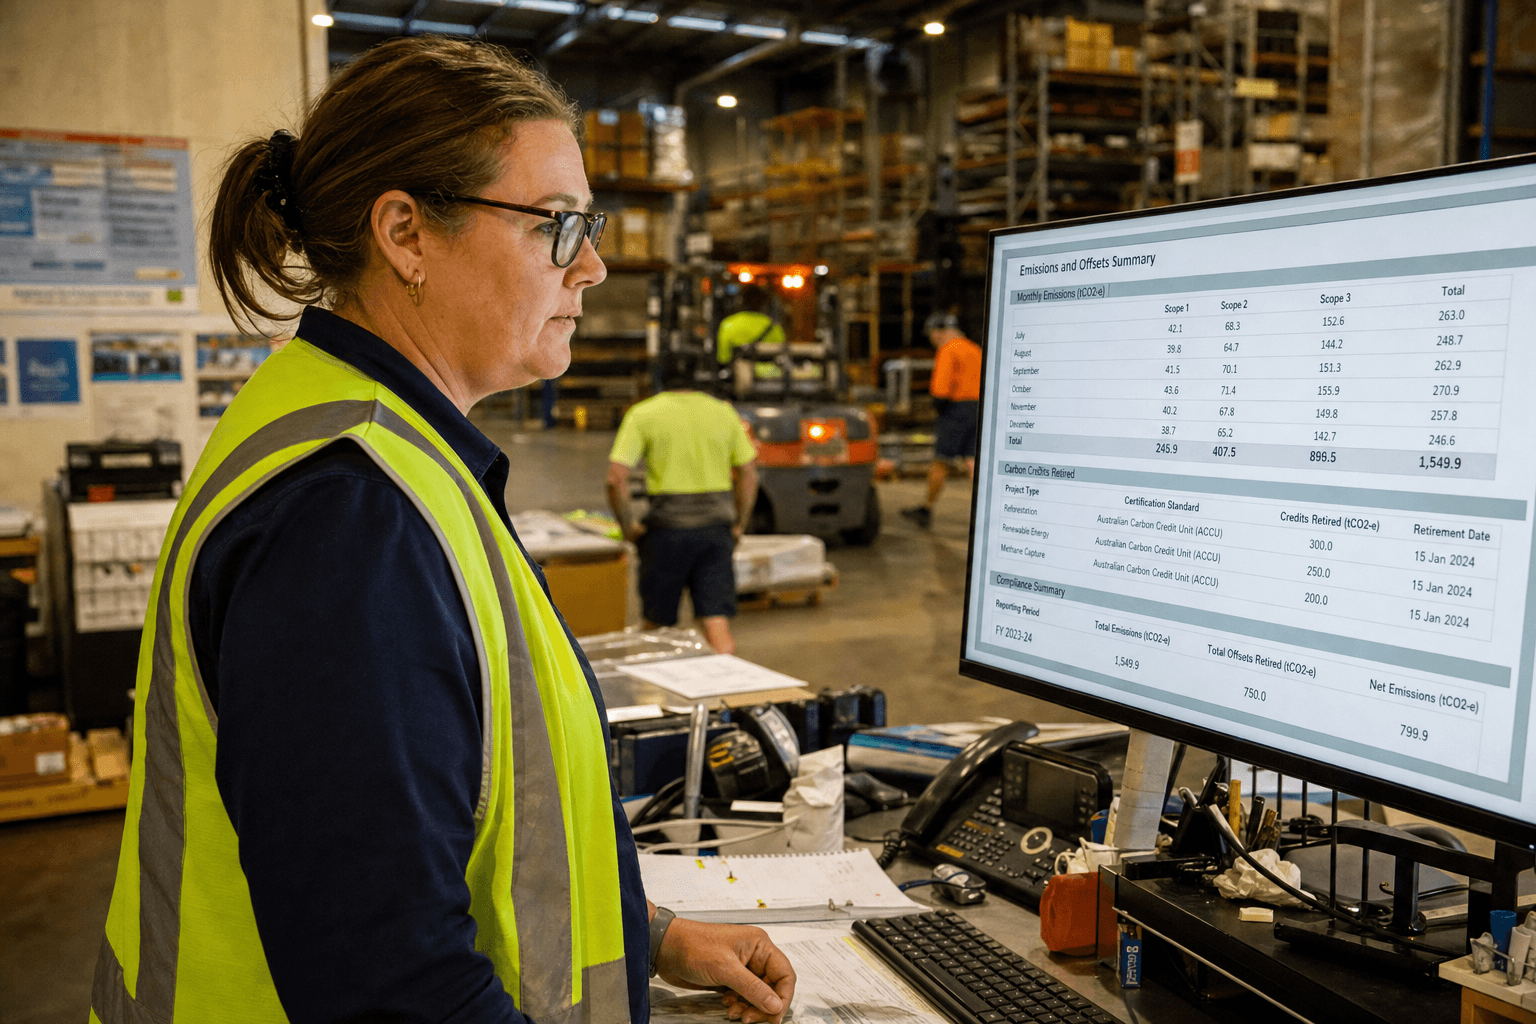
- Annual compliance reports: AASB S2-aligned disclosures with full audit trail
- Per-consignment emissions: API endpoint that returns kg CO2e per shipment for customer-facing reporting
The per-consignment API is increasingly important. Your customers need this data for their own Scope 3 reporting. Being able to provide it programmatically — not via email with a PDF attachment — is becoming a competitive differentiator.
Handling Subcontractors
Subcontractor emissions are the hardest piece. You have three approaches, in order of accuracy:

Best: Primary data via API Your subcontractor shares fuel consumption and distance data through an API integration. Rare today, but becoming more common as larger carriers build their own reporting systems.
Good: Structured self-reporting Provide subcontractors with a simple portal or form to submit monthly data: total litres consumed, total kilometres, vehicle types. Apply standard emission factors.
Acceptable: Estimation Use distance-based estimation from your TMS data (origin, destination, mode) with NGER emission factors. Less accurate, but defensible for initial reporting periods.
The key is documenting your methodology and improving data quality over time. Auditors accept estimation with documented methodology. They don't accept guesswork without documentation.
Real Numbers
A national carrier with 1,200 vehicles and 40 subcontractors implemented automated emissions tracking in 90 days. The results:
- From 3 weeks to 2 hours for quarterly emissions calculations
- Per-consignment carbon data available via API for their top 20 customers
- $0 additional headcount — the finance team that spent 3 weeks on spreadsheets now spends 2 hours on review and sign-off
- Audit-ready from day one — full data lineage from source system to reported figure
Building automated emissions tracking requires integrating data from multiple sources — GPS systems, fuel cards, and transport management platforms. Our emissions reporting service helps logistics companies replace manual processes with automated pipelines that pull real-time data and generate compliant reports. For companies with older systems, legacy modernisation can connect existing fleet management tools to modern emissions tracking platforms.
Getting Started
Don't try to boil the ocean. Start with your highest-volume emissions source (usually Scope 1 — own fleet fuel consumption), automate that pipeline, validate the numbers against your existing manual process, then expand to Scope 3.
The first automated pipeline takes 6-8 weeks. Each additional data source takes 2-4 weeks. Within a quarter, you'll have a system that runs itself.
Zero Footprint
The Zero Footprint team — AI modernisation for Australian logistics.