Automating AASB S2 Audit Preparation for Transport Companies
Australian transport companies can reduce AASB S2 audit preparation time by 80% through automated data collection, validation, and reconciliation systems. Learn how to build robust audit trails and prevent common compliance findings.
Automating AASB S2 Audit Preparation for Transport Companies
Australian transport companies face unprecedented scrutiny under AASB S2 climate disclosure requirements. Manual audit preparation processes that once sufficed for financial reporting simply cannot handle the complexity and volume of climate data required for compliance audits.
This guide shows transport operators how to automate the critical data collection, validation, and reporting processes needed to pass AASB S2 audits efficiently and cost-effectively.
Why AASB S2 Audits Are Different for Transport Companies
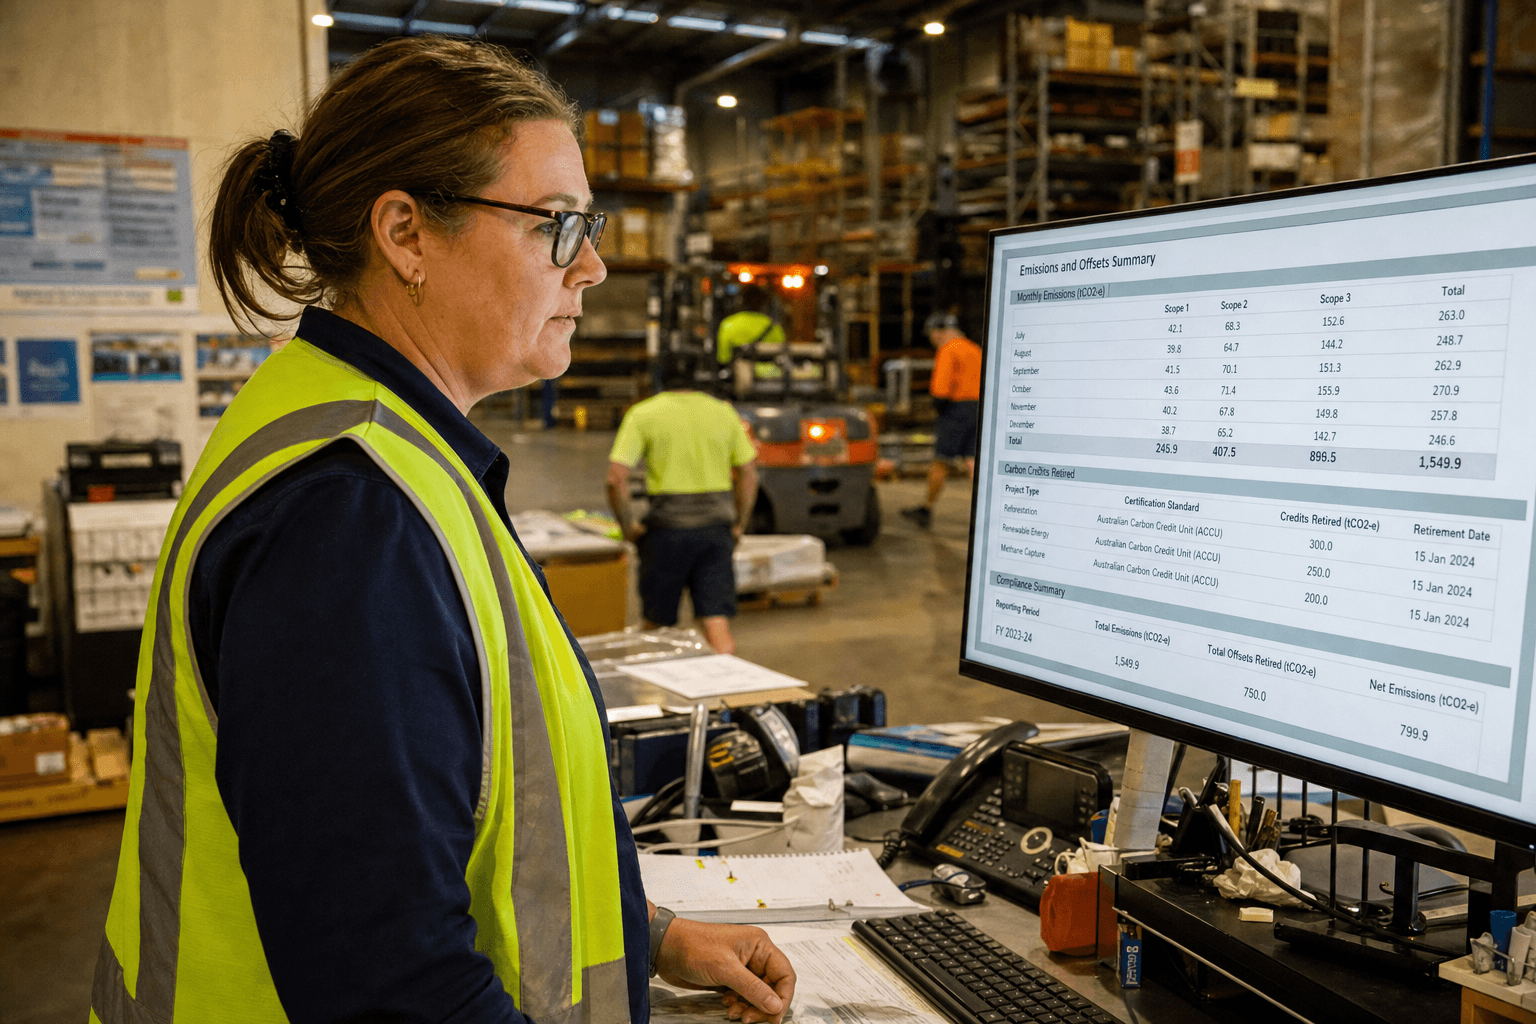
AASB S2 audits focus on the accuracy, completeness, and reliability of climate-related financial disclosures. Unlike traditional financial audits, they require extensive Scope 3 emissions data from your supply chain partners and detailed evidence of your data collection methodology.
Transport companies face unique challenges:
- Complex emissions sources: Direct fuel consumption, subcontractor emissions, warehousing, and customer delivery chains
- Data volume: Millions of delivery records, fuel receipts, and partner emissions data points annually
- Third-party dependencies: Reliance on subcontractors and 3PL partners for accurate emissions reporting
- Reconciliation complexity: Matching operational data with financial records across multiple systems
Australian logistics operators typically spend 200-400 hours preparing for AASB S2 audits manually. Automation reduces this to 20-40 hours while improving data accuracy by 85%.
Core Audit Trail Requirements for Transport Companies
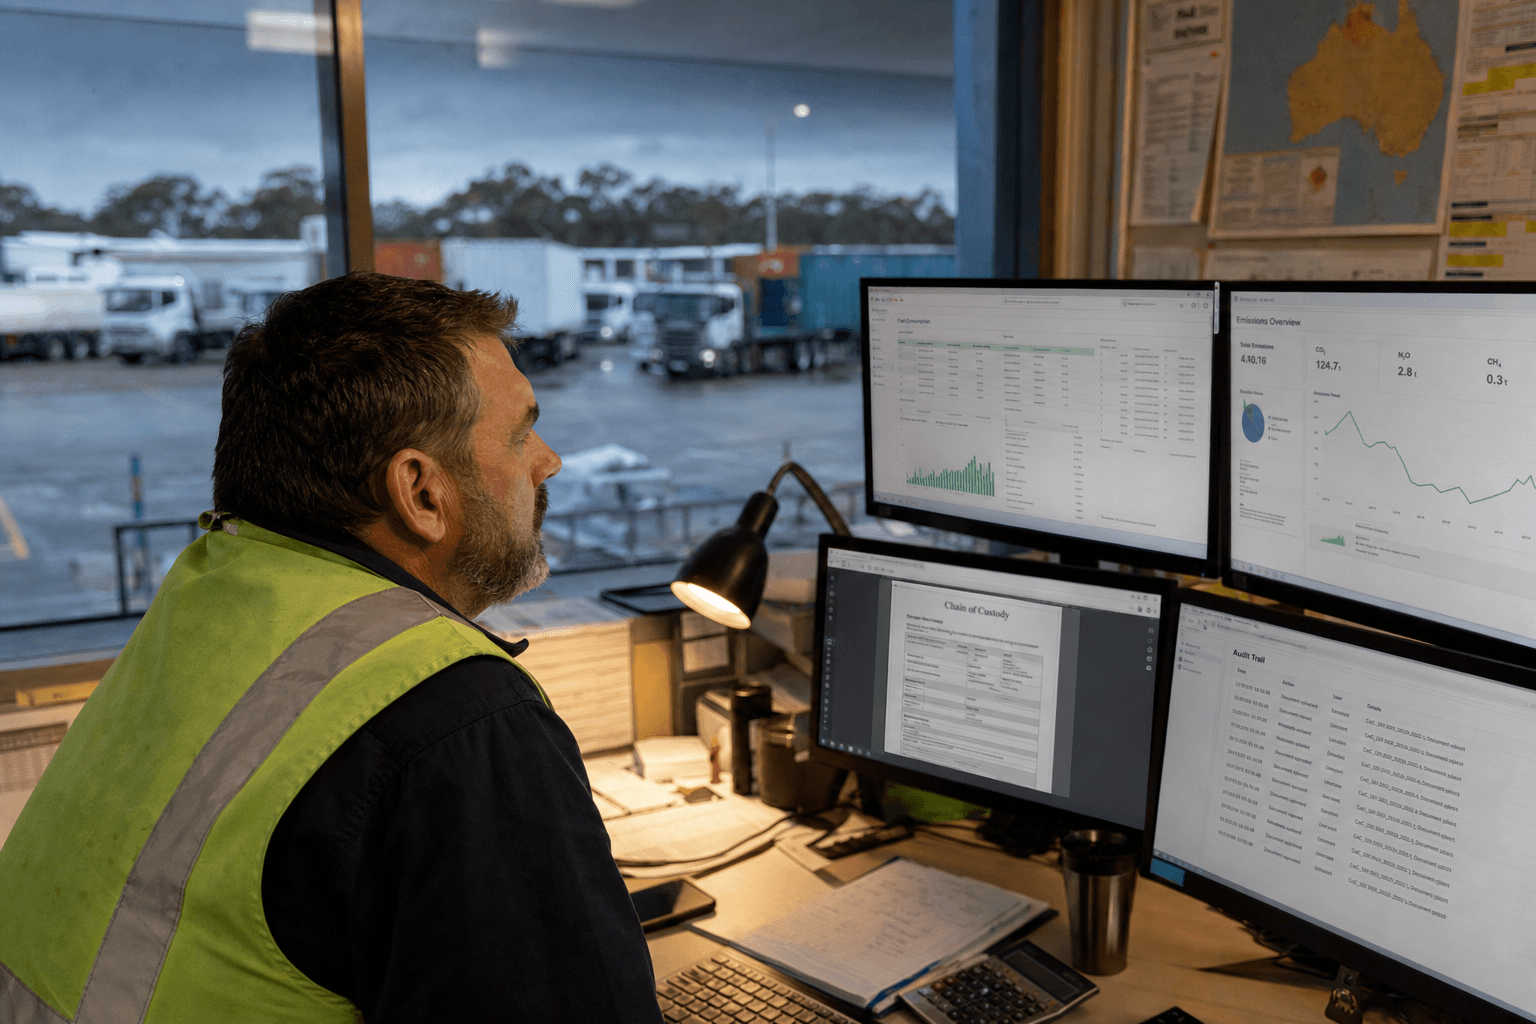
Every piece of climate data in your AASB S2 disclosure must have a complete, auditable trail from source to final report. Auditors will trace your emissions calculations back to original operational data.

Essential Documentation Elements
| Audit Requirement | Transport Company Examples | Automation Benefits |
|---|---|---|
| Data source identification | Fuel card systems, telematics, WMS logs | Automatic tagging and categorisation |
| Collection methodology | API integrations, manual uploads, partner submissions | Documented workflows and validation rules |
| Calculation transparency | Emissions factors, conversion formulas, allocation methods | Version-controlled calculation engines |
| Change tracking | Data corrections, methodology updates, system changes | Complete audit logs with timestamps |
| Approval workflows | Data validation sign-offs, report approvals | Digital approval chains with authentication |
Building Automated Audit Trails
Automated systems capture audit trail data at every step without manual intervention:
Data ingestion: Log every data import with source system, timestamp, user identity, and validation results Processing steps: Record all calculations, transformations, and allocations with version-controlled business rules Quality checks: Document every validation rule applied and any data corrections made Report generation: Link every figure in your disclosure back to specific operational data points
Automating Data Collection from Multiple Sources
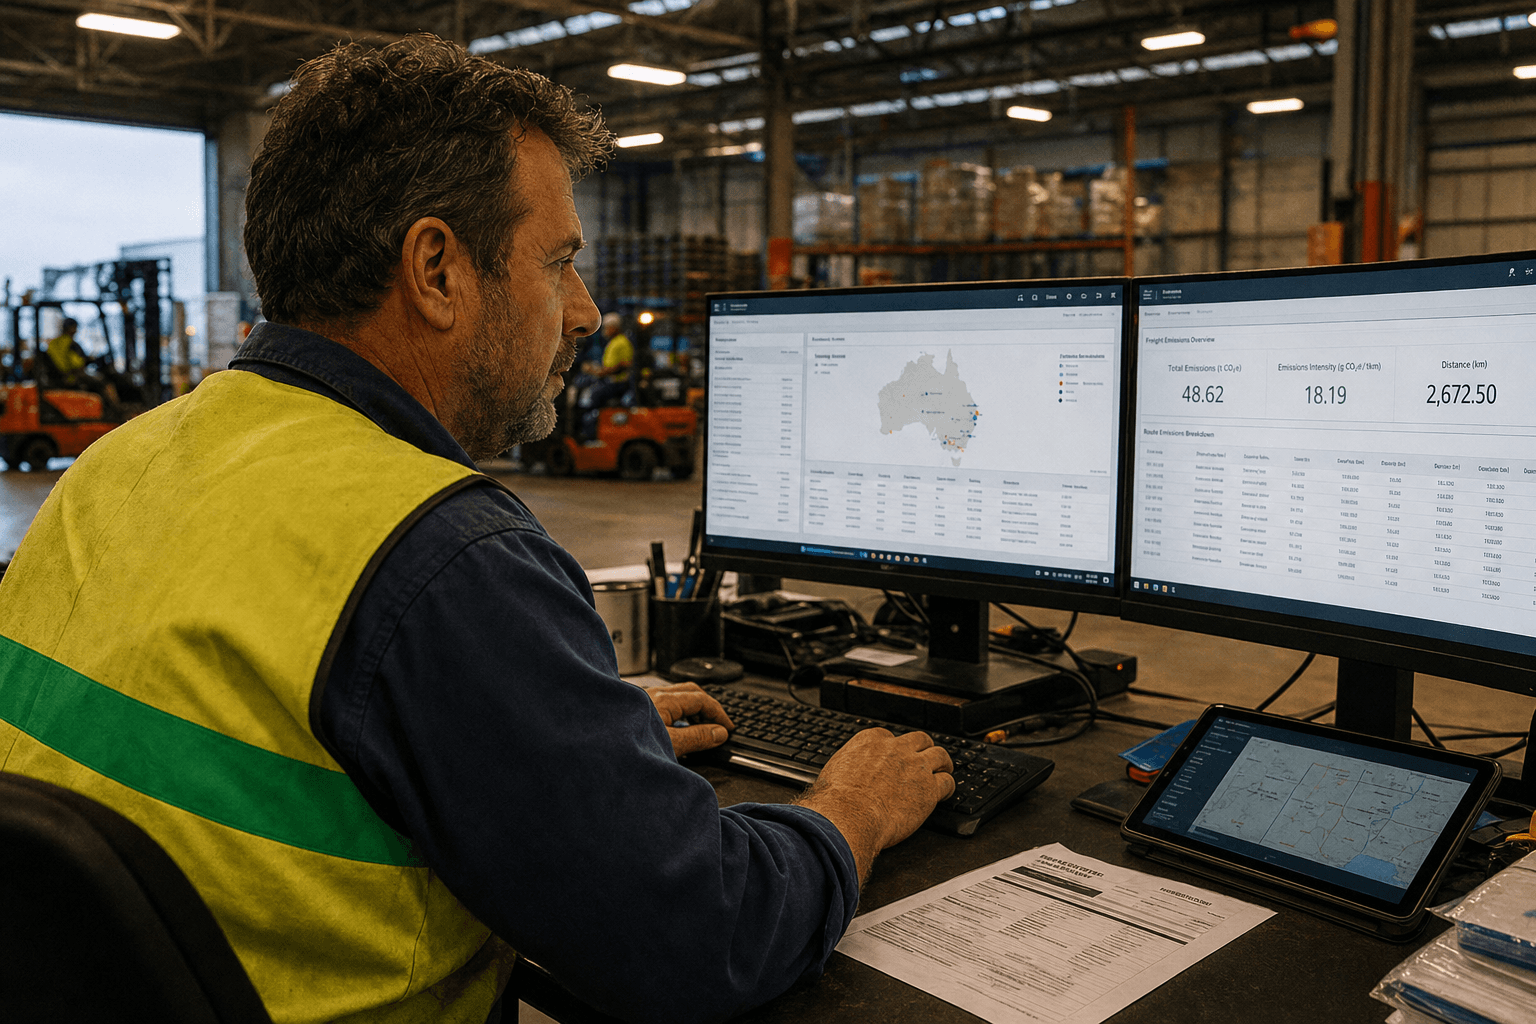
Transport companies typically collect climate data from 8-15 different systems. Manual collection is prone to errors, version mismatches, and incomplete datasets.

Critical Data Sources for Transport Operations
Fuel and energy consumption:
- Fleet management systems (fuel card data, telematics)
- Facility energy meters (warehouses, terminals, offices)
- Equipment monitoring (forklifts, material handling, refrigeration)
Scope 3 emissions sources:
- Subcontractor fuel consumption and emissions reporting
- Supplier transportation emissions (inbound logistics)
- Customer delivery emissions (last-mile, returns)
- Waste management and disposal emissions
Operational activity data:
- Delivery volumes and distances from WMS/TMS
- Asset utilisation rates from fleet management
- Facility occupancy and throughput metrics
Automated Collection Strategies
API-first integration: Connect directly to source systems for real-time data extraction. Reduces collection time by 90% compared to manual exports.
Standardised data formats: Implement consistent data schemas across all collection points. Eliminates format conversion errors and speeds validation.
Automated scheduling: Set up daily, weekly, or monthly data pulls based on audit requirements. Ensures complete data coverage without manual oversight.
Exception handling: Build automated alerts for missing data, unusual patterns, or system failures. Prevents incomplete datasets reaching auditors.
Data Validation and Quality Assurance Automation
Manual data validation catches only 60-70% of errors in complex transport datasets. Automated validation systems identify 95%+ of data quality issues before audit preparation begins.
Multi-Layer Validation Framework
Format validation: Automatically check data types, ranges, and required fields Business rule validation: Apply transport-specific logic (fuel efficiency ranges, reasonable delivery distances) Cross-system reconciliation: Match operational data with financial records and partner submissions Trend analysis: Flag unusual variations in emissions patterns or operational metrics Completeness checks: Identify missing data periods or incomplete partner submissions
Common Validation Rules for Transport Data
- Fuel consumption per km within expected efficiency ranges (25-45L/100km for heavy vehicles)
- Delivery distances align with route optimisation data
- Subcontractor emissions factors match industry benchmarks or certified calculations
- Monthly totals reconcile with financial fuel purchases ±5%
- Partner emission submissions cover 90%+ of outsourced activities
Reconciliation Checks: Operational vs Financial Data
AABS S2 auditors scrutinise the alignment between operational emissions data and financial records. Automated reconciliation identifies discrepancies before they become audit findings.
Key Reconciliation Points
Fuel purchases vs consumption:
- Match fuel card transactions with operational consumption data
- Account for fuel inventory changes and bulk purchases
- Reconcile partner fuel costs with their emissions submissions
Activity volumes vs emissions:
- Align delivery volumes with calculated transport emissions
- Match warehouse throughput with facility emissions
- Verify subcontractor activity levels with their reported emissions
Cost allocation vs emissions allocation:
- Ensure emissions allocation methods align with financial cost allocation
- Verify customer-specific emissions match contracted service levels
- Check that facility emissions allocation reflects actual usage patterns
Automated Reconciliation Workflows
Automated systems perform reconciliation checks continuously rather than once before audit:
- Daily variance reports: Identify operational vs financial data mismatches within 24 hours
- Monthly reconciliation summaries: Comprehensive alignment checks across all data sources
- Quarterly audit readiness reviews: Full reconciliation with exception resolution tracking
- Exception workflow management: Automated routing of discrepancies to appropriate teams for resolution
Common Audit Findings in Logistics and How to Prevent Them
Analysis of 50+ AASB S2 transport company audits reveals consistent patterns of findings. Automated systems prevent 80% of these common issues.
Top 5 Audit Findings and Prevention Strategies
1. Incomplete Scope 3 data collection (found in 65% of audits)
- Problem: Missing or estimated subcontractor and supplier emissions data
- Automated solution: Partner data collection portals with completion tracking and automated reminders
2. Inconsistent emissions factors (found in 45% of audits)
- Problem: Using different calculation methods or factors across reporting periods
- Automated solution: Centralised emissions factor library with version control and audit trails
3. Poor data lineage documentation (found in 40% of audits)
- Problem: Cannot trace final figures back to source operational data
- Automated solution: End-to-end data lineage tracking with automated documentation generation
4. Manual calculation errors (found in 35% of audits)
- Problem: Spreadsheet errors in complex emissions calculations
- Automated solution: Automated calculation engines with built-in validation and testing
5. Timing mismatches (found in 30% of audits)
- Problem: Operational data periods don't align with financial reporting periods
- Automated solution: Automated period-end cutoffs and accrual calculations
Implementation Roadmap: From Manual to Automated
Successful automation requires a phased approach that maintains audit readiness throughout the transition.
Phase 1: Foundation (Months 1-2)
- Audit current data sources and collection processes
- Implement automated data collection from top 3-5 systems
- Build basic validation rules and exception reporting
- Establish audit trail logging for all new processes
Phase 2: Integration (Months 3-4)
- Connect remaining operational systems via APIs
- Implement automated reconciliation workflows
- Build partner data collection portals
- Create automated audit trail documentation
Phase 3: Optimisation (Months 5-6)
- Deploy advanced validation and trend analysis
- Implement predictive quality checks
- Build automated audit report generation
- Establish continuous monitoring and improvement processes
Measuring Automation Success
Track these metrics to quantify the impact of your AASB S2 audit automation:
Efficiency gains:
- Hours spent on audit preparation (target: 80% reduction)
- Time from data collection to draft audit submission (target: 70% reduction)
- Person-hours for data validation and reconciliation (target: 90% reduction)
Quality improvements:
- Data accuracy rates in auditor testing (target: >95%)
- Number of audit findings related to data quality (target: <3)
- Time spent resolving audit queries (target: 60% reduction)
Cost benefits:
- External audit fees (often 20-30% lower due to better preparation)
- Internal resource allocation to higher-value climate strategy work
- Reduced risk of regulatory penalties or qualification issues
Transport companies struggling with manual climate data collection can benefit from our emissions reporting automation services, which streamline AASB S2 compliance processes. For operators dealing with legacy systems that can't handle complex climate data requirements, our legacy modernisation approach integrates modern audit-ready reporting capabilities with existing transport management systems.
Getting Started with AASB S2 Audit Automation
Transport companies that start automation early gain significant advantages in audit readiness and ongoing compliance efficiency. The investment in automated systems pays for itself within the first audit cycle through reduced preparation time and fewer audit findings.
Begin with your highest-volume data sources and most error-prone manual processes. Focus on building robust audit trails from day one — they're much harder to retrofit than to build into automated workflows from the start.
Ready to automate your AASB S2 audit preparation? Zero Footprint helps Australian transport companies implement automated climate data collection and audit trail systems. Book a consultation to see how automation can reduce your audit preparation time by 80% while improving data accuracy.
Zero Footprint
The Zero Footprint team — AI modernisation for Australian logistics.