The Real Cost of Manual Carbon Reporting (And What to Do About It)
Manual carbon reporting costs more than you think — in staff time, errors, missed contracts, and audit risk. Here's what it actually costs and how to fix it.
It's Not Free Just Because Nobody's Billing for It
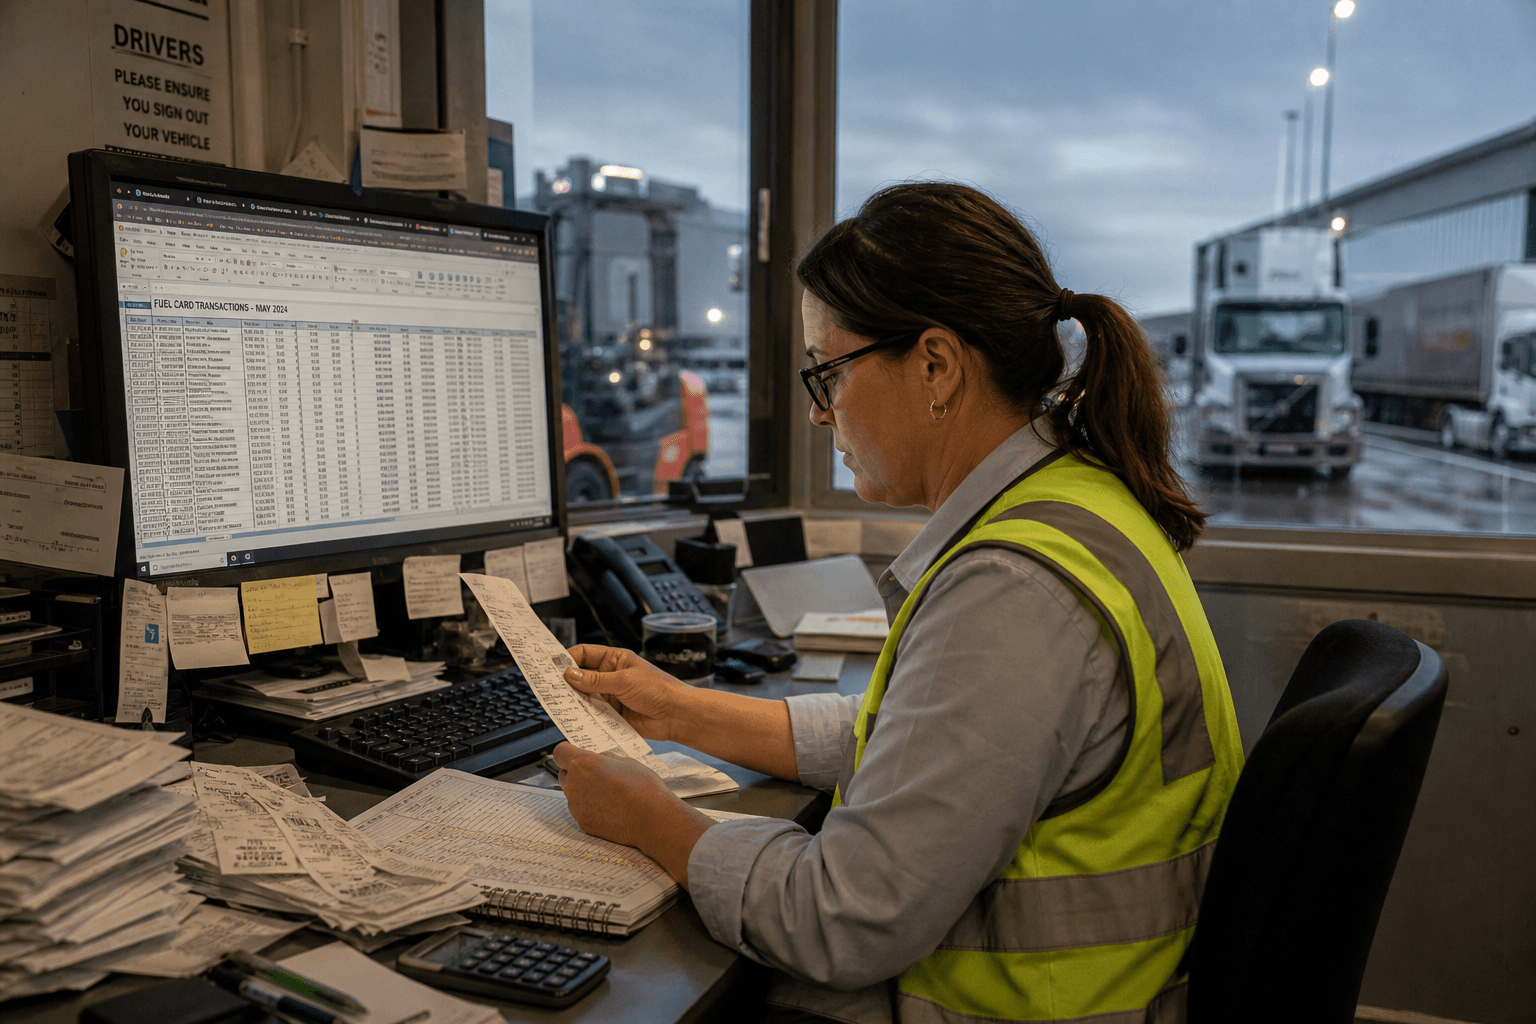
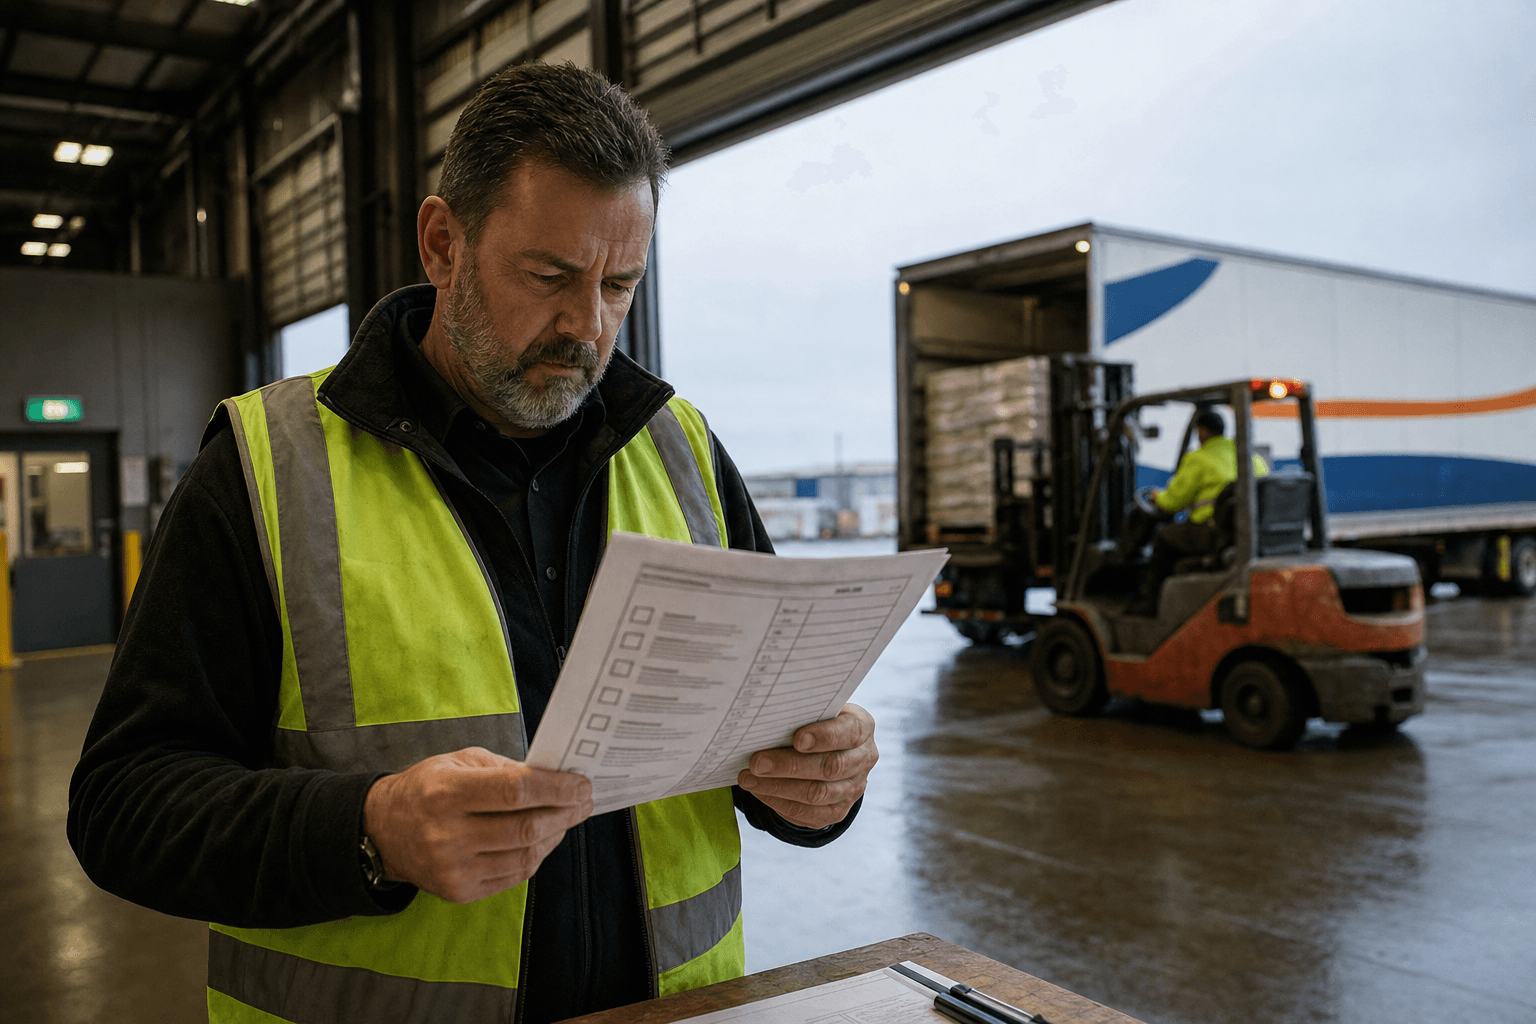
Most logistics companies treat carbon reporting as a finance team side project. Someone spends a few weeks per quarter pulling fuel card data, chasing subcontractors for numbers, and wrestling with spreadsheet formulas. It gets done. Nobody complains.
But it costs more than you think.
The Direct Costs
Staff Time
A typical mid-market carrier (200-500 vehicles, 20-40 subcontractors) spends:
- 60-80 hours per quarter on data collection and reconciliation
- 20-30 hours per quarter on calculation and report preparation
- 10-15 hours per quarter on review and corrections
That's 90-125 hours per quarter — roughly one full-time equivalent working half the year on carbon reporting alone. At loaded cost, that's $40,000-$60,000 per year in staff time.
Error Correction
Manual processes have error rates. In our experience, manual emissions calculations contain errors in 15-25% of line items. Most are small — a wrong emission factor, a transposed vehicle ID, a missing month of subcontractor data. But they compound.
When errors are caught during audit (or worse, by a customer), the cost of investigation, correction, and re-reporting typically runs $5,000-$15,000 per incident.
External Consultants
Many companies hire external consultants for their first AASB S2 report. Expect $30,000-$80,000 for a mid-market logistics company. That's a reasonable investment for year one. But if the underlying data processes haven't improved, you'll need them again next year.
The Hidden Costs
Lost Contracts
This is the big one. We're seeing RFPs from major retailers and FMCG companies that require per-shipment emissions data as a pass/fail criterion. If you can't provide it — or can only provide it manually with a 2-week turnaround — you're losing bids to carriers who can.
One 3PL we spoke to estimated they lost $2.4M in annual revenue from three contracts where the deciding factor was emissions data capability. Their manual process couldn't meet the customer's requirement for per-consignment carbon data via API.
Audit Risk
ASIC has signalled that climate-related disclosures will be subject to the same scrutiny as financial statements. Manual processes with poor data lineage create audit risk. If an auditor asks "how did you arrive at this Scope 3 number?" and the answer involves chasing down who modified which cell in which spreadsheet, you have a problem.
Opportunity Cost
Every hour your operations or finance team spends on carbon reporting is an hour they're not spending on their actual job. For a logistics company, that's time not spent on route optimisation, customer service, or fleet management — activities that directly affect revenue.
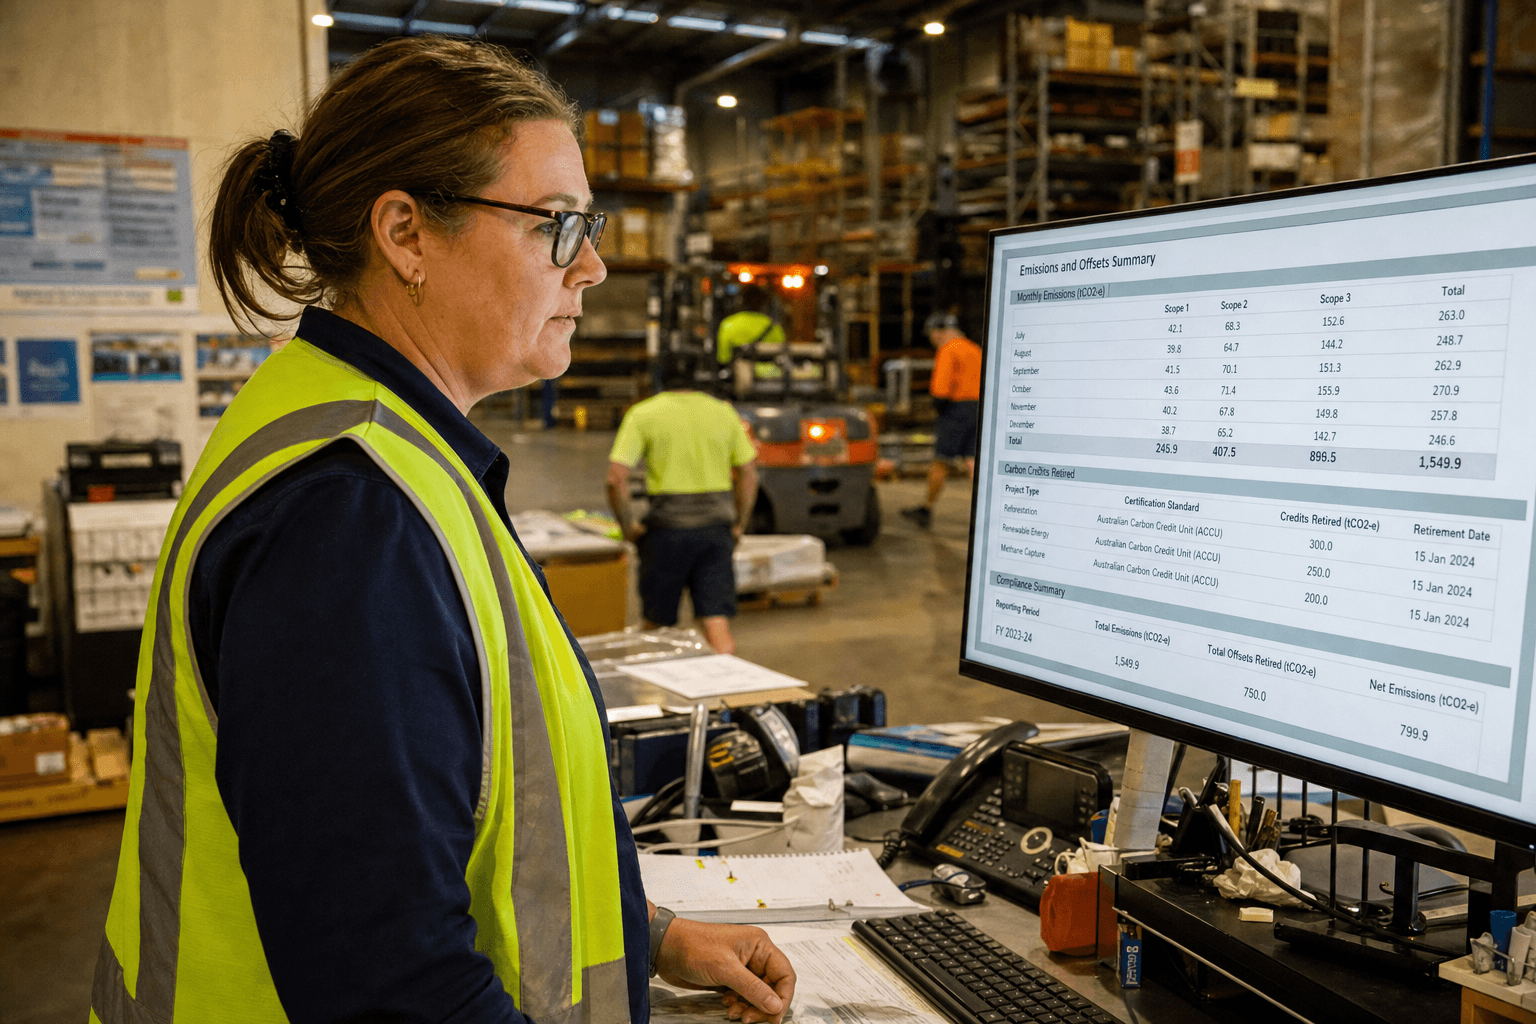
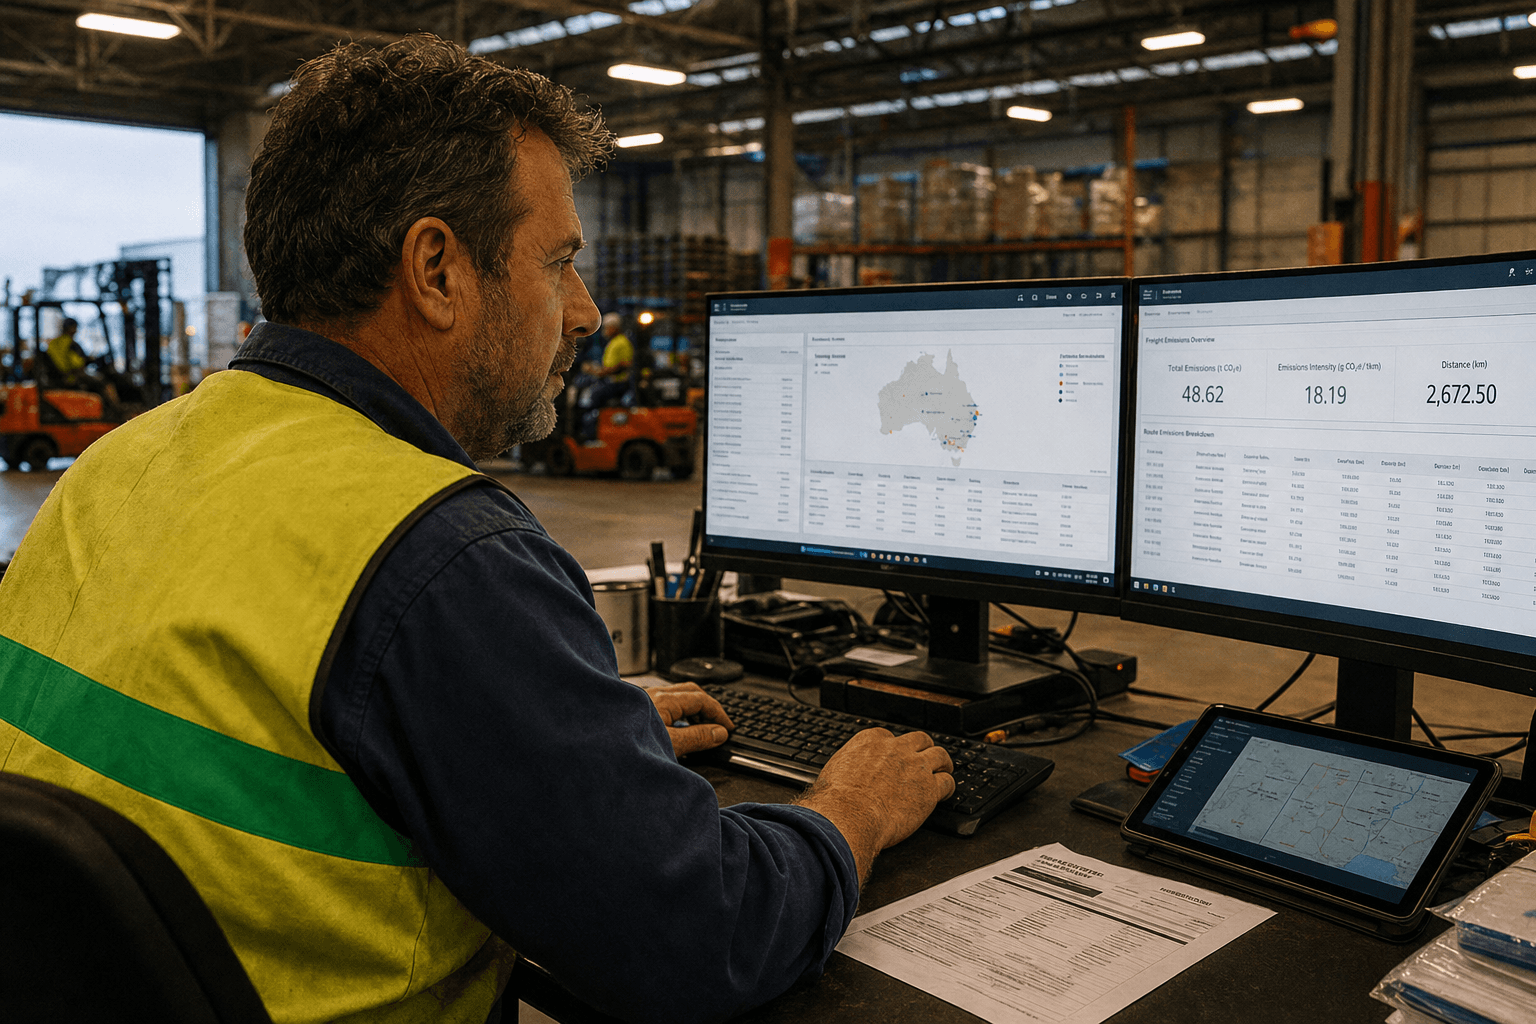
What Automation Changes
| Metric | Manual Process | Automated Pipeline |
|---|---|---|
| Quarterly reporting time | 90-125 hours | 2-4 hours (review only) |
| Error rate | 15-25% of line items | <1% (validated at ingestion) |
| Per-consignment data turnaround | 2+ weeks (if possible) | Real-time API |
| Audit trail | Spreadsheet version history | Full data lineage, source to report |
| Annual cost (steady state) | $60,000-$100,000+ | $10,000-$20,000 (hosting + maintenance) |
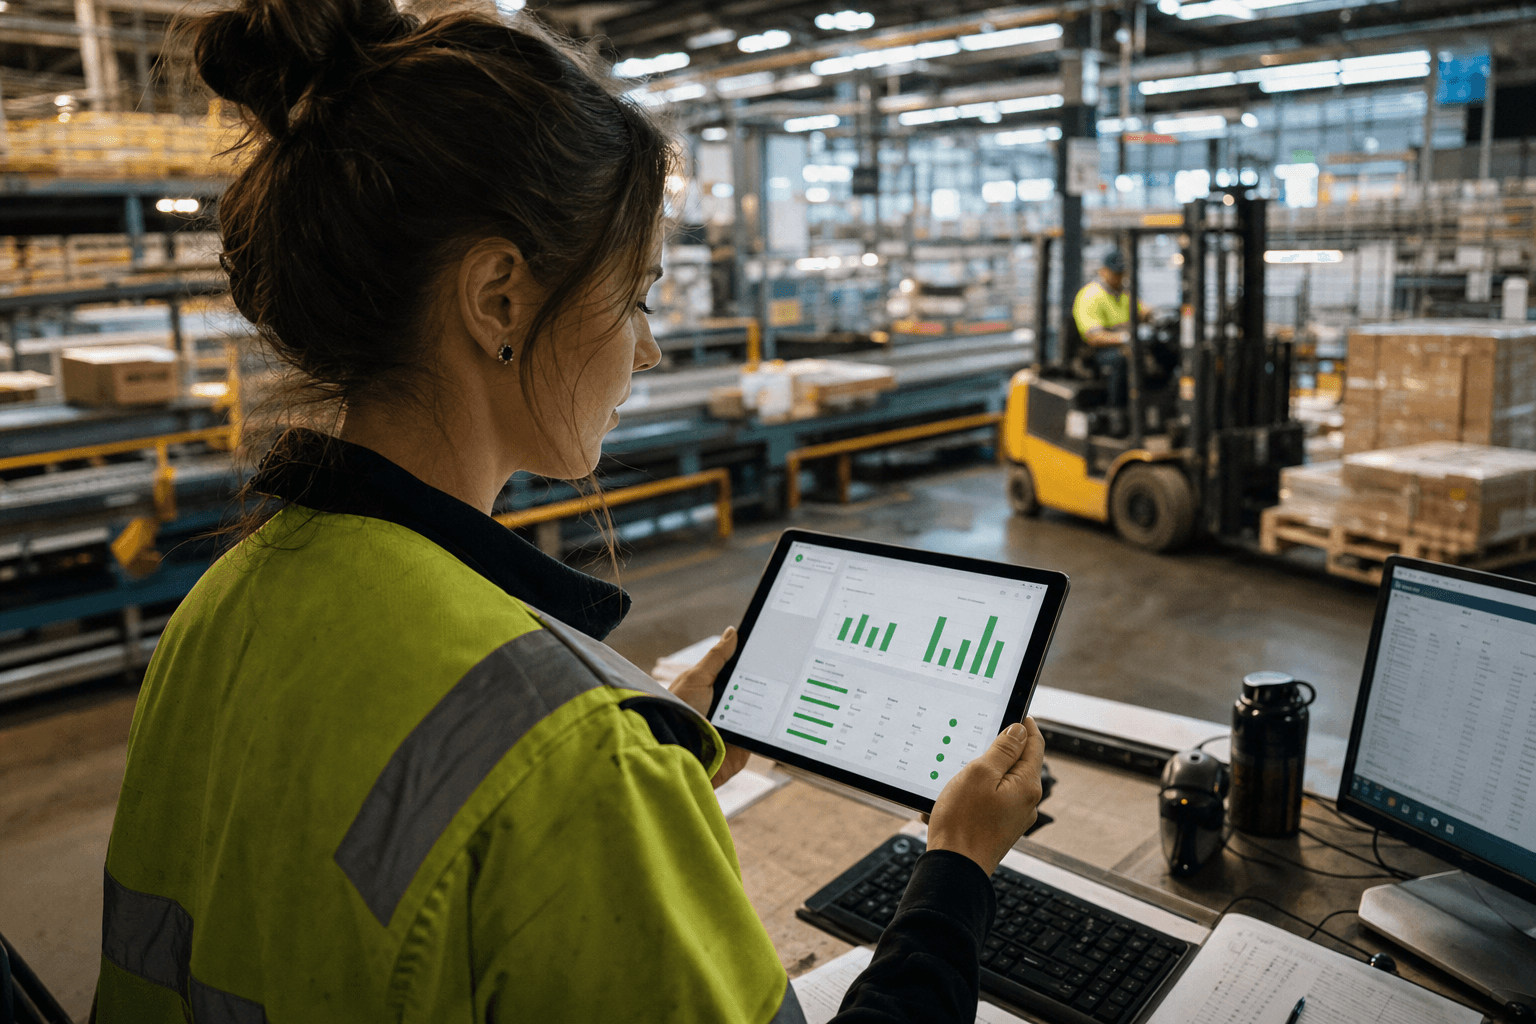
The automation investment typically pays for itself within the first year, before accounting for the revenue protection from contract retention.
The Calculation
For a mid-market logistics operator:
Manual annual cost:
- Staff time: $50,000
- Error correction: $10,000
- External support: $30,000
- Lost revenue risk: $500,000+ (one contract loss)
- Total: $90,000+ (excluding revenue risk)
Automation investment:
- Implementation: $40,000-$80,000 (one-time)
- Annual running cost: $10,000-$20,000
- Year 1 total: $50,000-$100,000
- Year 2+ total: $10,000-$20,000
By year two, automated reporting costs 70-80% less than manual. And you get per-consignment data capability that protects revenue.
If you're spending hours every quarter wrestling with spreadsheets and chasing data, our emissions reporting service can automate the entire process. For companies looking to modernise their approach beyond just carbon reporting, our AI readiness assessment identifies where automation can deliver the biggest operational wins.
What to Do
If you're still running carbon reporting from spreadsheets:
- Quantify your current cost — track the hours your team actually spends, including chasing subcontractors and fixing errors
- Identify your highest-volume data sources — fleet GPS, fuel cards, and TMS cover 80% of most logistics emissions
- Start with Scope 1 — your own fleet is the easiest to automate and the most accurate
- Build the per-consignment API early — this is what customers will ask for, and it's hard to retrofit
The companies that automate now will have clean, auditable data and customer-ready APIs when the broader AASB S2 thresholds take effect. The ones that keep using spreadsheets will be hiring more staff to do the same work, slower.
Get a cost assessment for automating your emissions reporting →
Ready to eliminate the hidden costs of manual carbon reporting? We help logistics companies automate their emissions tracking and cut reporting time by 90%. Get in touch to discuss how we can streamline your carbon reporting process.
Zero Footprint
The Zero Footprint team — AI modernisation for Australian logistics.