How AI Route Optimisation Cuts Logistics Costs by 25%
Fuel is your biggest variable cost and most of it is wasted on inefficient routes. Here's how AI route optimisation delivers 15-25% cost reduction for Australian logistics operators.
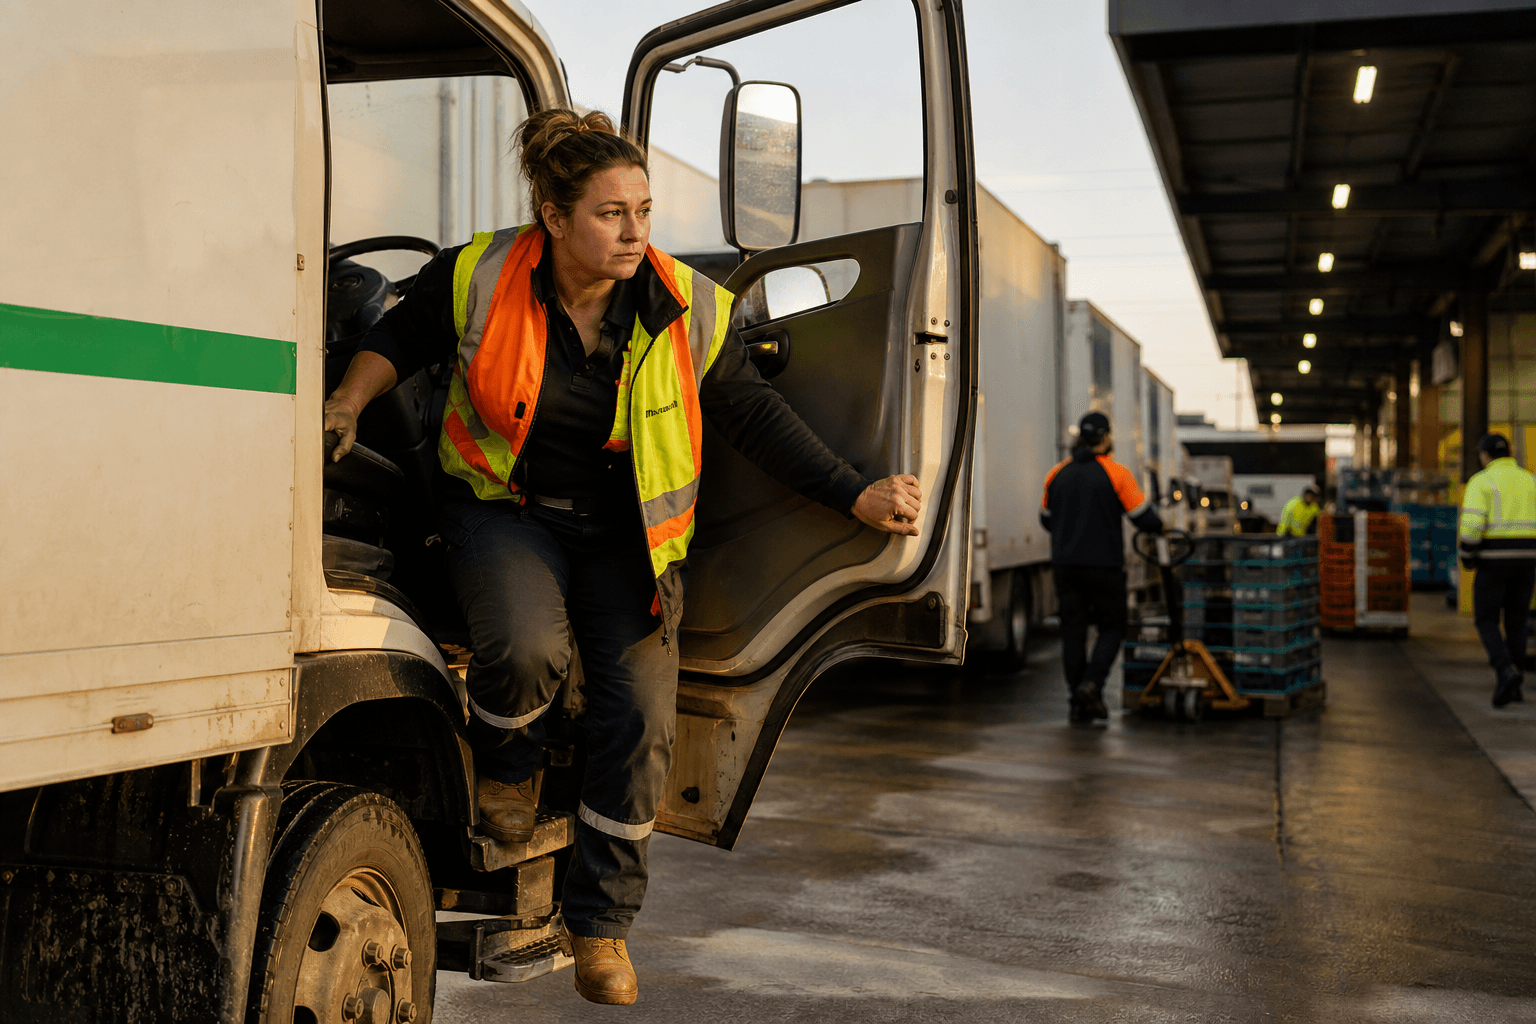
Your Routes Are Costing You More Than You Think
Fuel is the largest variable cost for most logistics operators — typically 25-35% of total operating costs. And most of it is wasted.
Not wasted in the obvious sense. Your drivers aren't taking joy rides. But the routes they're running were planned by humans using rules of thumb, local knowledge, and "the way we've always done it." That worked when fuel was cheap and margins were fat. Neither is true anymore.
AI route optimisation uses algorithms to plan routes that account for real constraints — driver hours, vehicle capacity, delivery windows, traffic patterns, and customer priorities — simultaneously. Humans can juggle 3-4 constraints at once. Algorithms handle dozens.
What 25% Actually Looks Like
For a metro delivery fleet running 100 vehicles, a 25% fuel reduction translates to roughly:
- $400,000-$600,000 per year in fuel savings (at current diesel prices)
- 15-20% fewer total kilometres driven
- 2-3 additional drops per driver per day (better route density)
- Reduced vehicle wear and maintenance intervals
These aren't theoretical numbers. They're what we see consistently across Australian metro delivery operations. Linehaul operations typically see 10-15% savings — lower percentage but larger absolute numbers per vehicle.
How It Works (Without the Buzzwords)
Constraint Modelling
The optimisation engine takes your real constraints as inputs:
- Delivery windows: Customer A needs delivery between 8-10am, Customer B after 2pm
- Vehicle capacity: Weight limits, volume limits, and mixed-load restrictions
- Driver hours: Fatigue management regulations, shift start/end times, break requirements
- Road restrictions: Height limits, weight limits, school zones, time-of-day restrictions
- Customer priorities: Premium customers get priority slots, fragile goods need direct routes
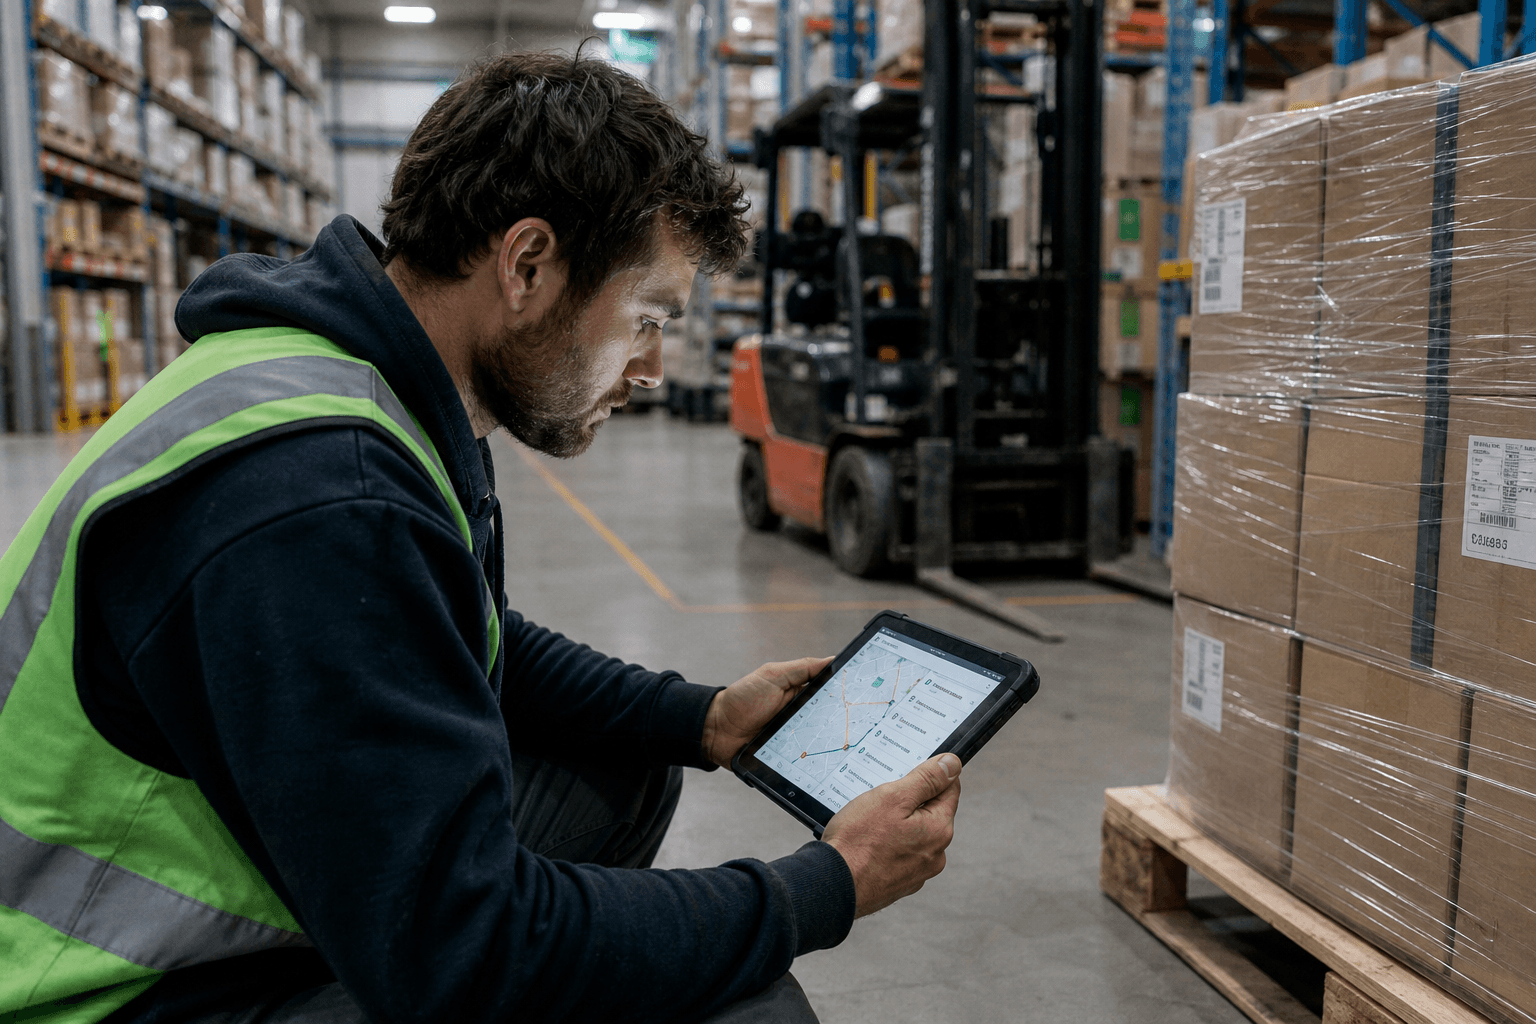
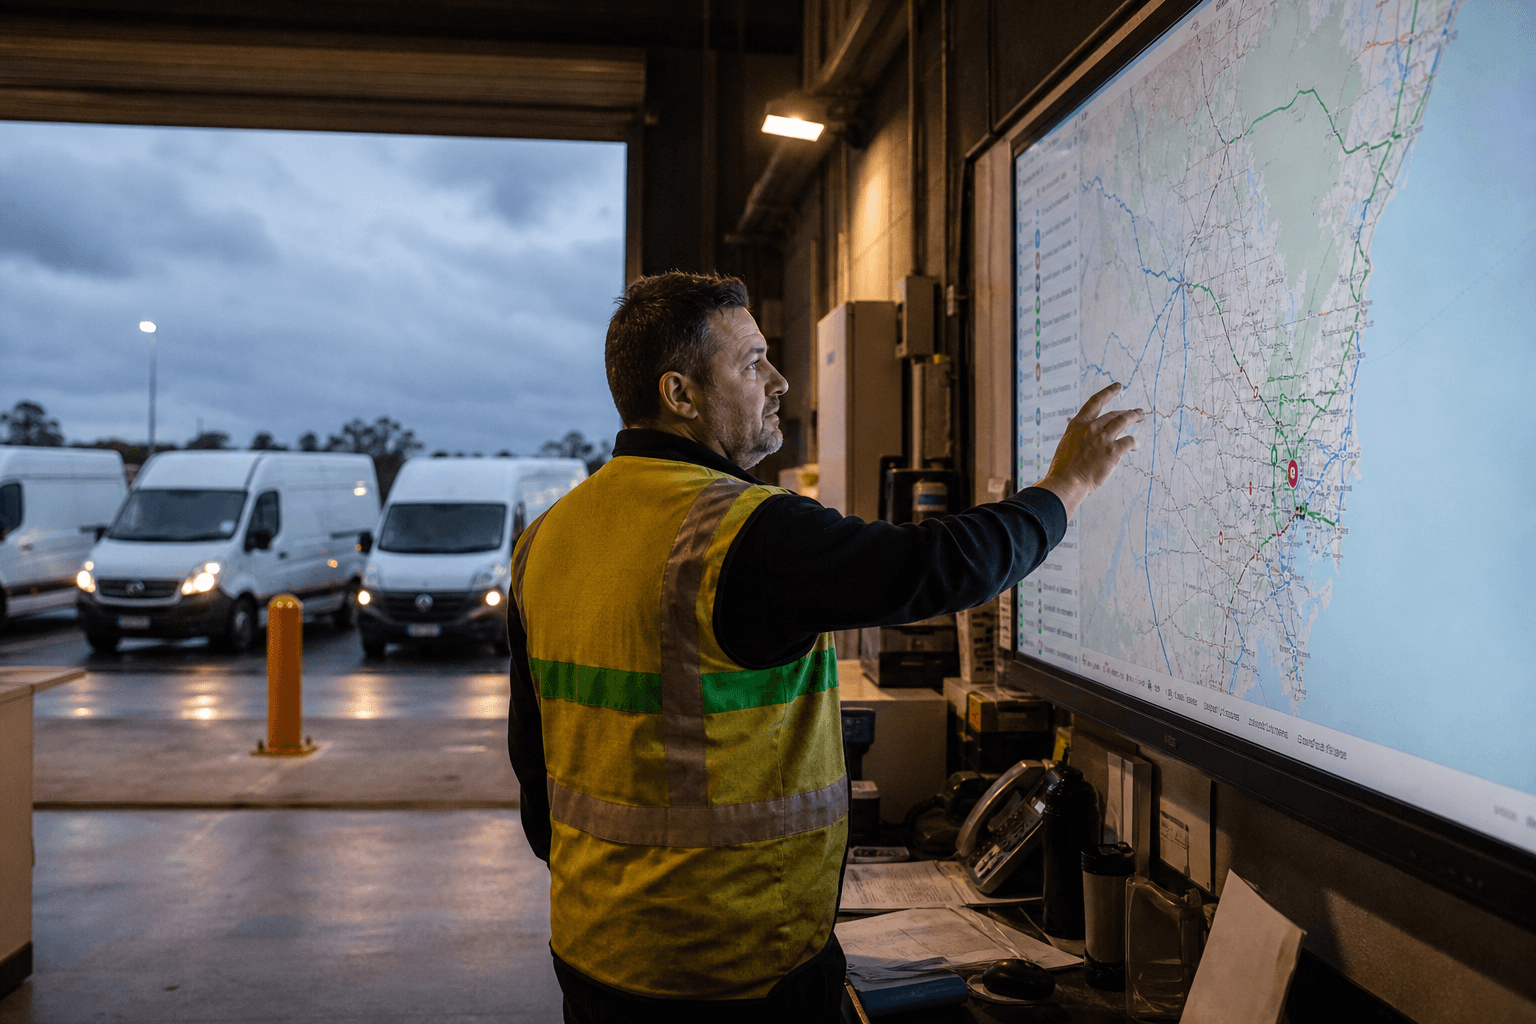
Dynamic Replanning
Static route plans break by 9am. A cancellation, a traffic incident, or an urgent add-on job means the plan is already wrong. AI route optimisation replans in real time — reassigning jobs, adjusting sequences, and notifying drivers through their existing devices.
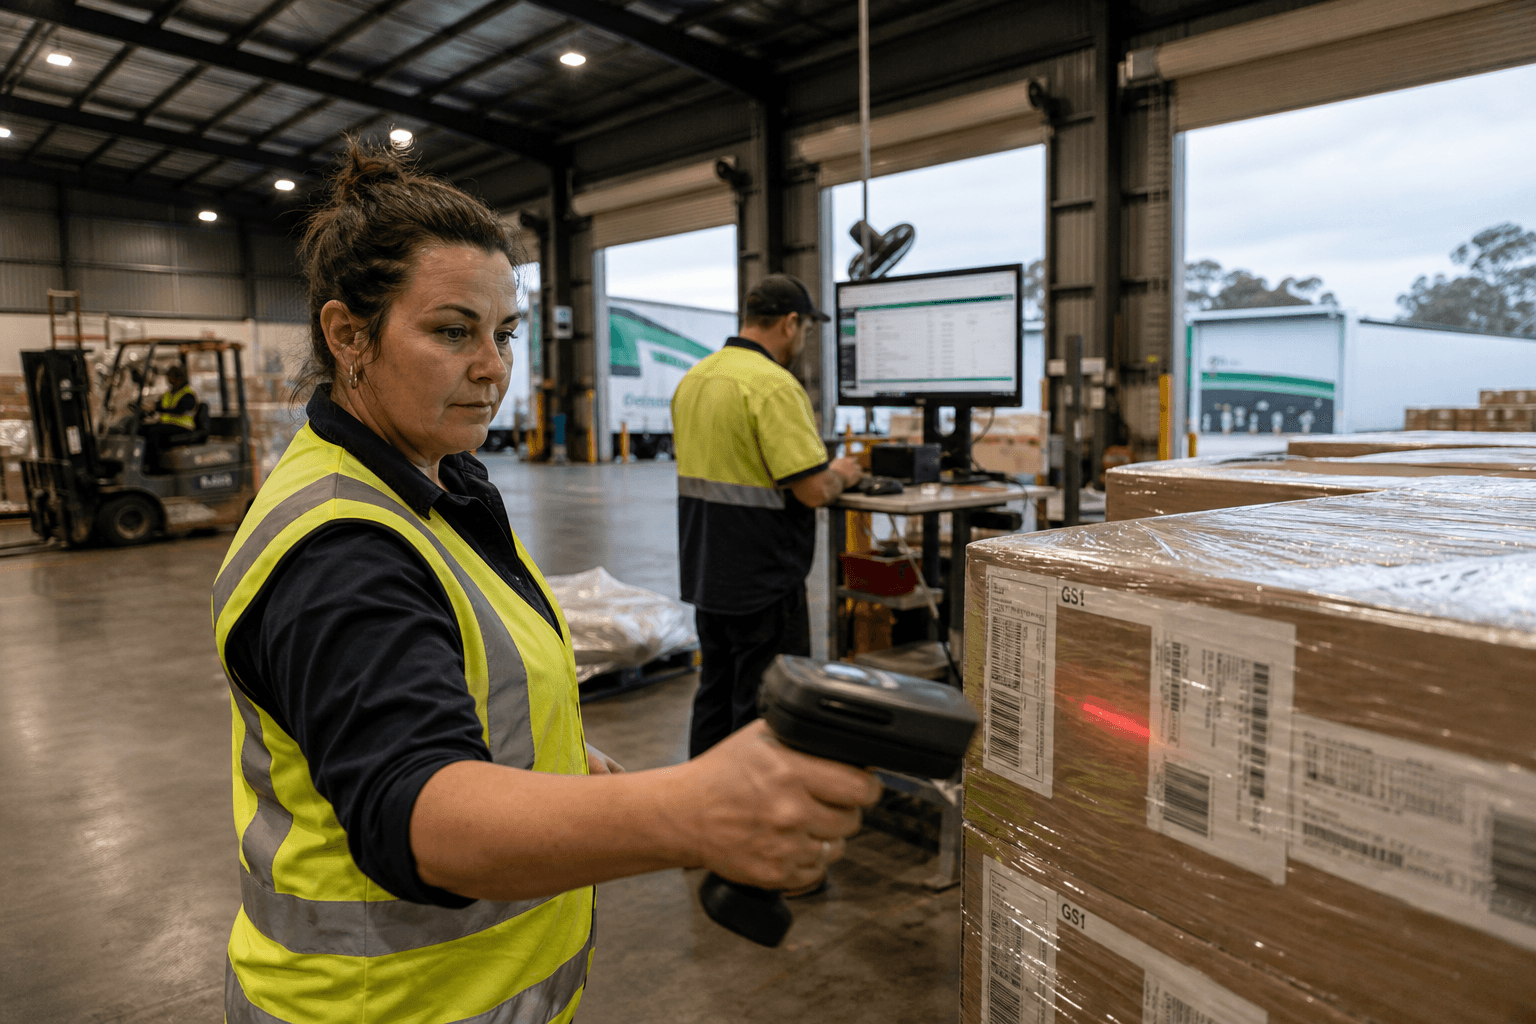
Load Consolidation
Route optimisation isn't just about driving fewer kilometres. It's about putting more drops on each run. By analysing delivery patterns and customer locations, the system consolidates loads that would otherwise go out on separate trucks.
One Melbourne metro fleet went from averaging 18 drops per run to 24 drops per run — a 33% improvement — without adding vehicles or extending driver hours.
The Linehaul Difference
Metro last-mile and interstate linehaul need different optimisation approaches:
Metro: Optimise for drop density. More stops per run, shorter distances between stops, tighter time windows. The wins come from route sequencing and load consolidation.
Linehaul: Optimise for load utilisation. Fewer stops, longer distances, variable loads. The wins come from demand forecasting (predicting what needs to move when) and backhaul optimisation (reducing empty running).
A linehaul operator running Melbourne-Sydney-Brisbane improved load utilisation from 72% to 89% by using demand forecasting to pre-position capacity. That eliminated 3 trucks from a 25-truck rotation — saving $450,000 per year in vehicle and driver costs.
What You Need to Get Started
Data Requirements
- Delivery addresses and time windows (from your TMS or order management system)
- Vehicle specs (capacity, fuel consumption, type restrictions)
- Driver information (shifts, home depot, licence class)
- Historical delivery data (3-6 months for pattern analysis)
Integration Points
The optimisation engine sits between your order management / TMS and your driver communication system. It reads jobs and constraints from your existing systems and outputs optimised routes — it doesn't replace anything.
Most implementations integrate via API. For older systems without APIs, we use file-based integration (CSV/XML exports) or database views.
Timeline
A typical implementation takes 8-12 weeks:
- Weeks 1-2: Data integration and constraint mapping
- Weeks 3-6: Algorithm configuration and testing against historical data
- Weeks 7-8: Parallel running (optimised routes alongside current routes for comparison)
- Weeks 9-12: Full rollout with driver training and process adjustment
Common Concerns
"My drivers know the routes better than any computer." They know the roads. They don't know the optimal sequence for 30 stops with 8 different time windows and 3 vehicle types. We consistently see 15-20% improvement even over experienced planners.
"We tried route optimisation software before and it didn't work." Most off-the-shelf route planning tools fail because they don't model real constraints properly. Australian-specific factors — fatigue management laws, remote delivery challenges, urban congestion patterns — need to be built in, not bolted on.
"Our customers won't accept changed delivery times." Good route optimisation works within your existing customer commitments. It finds better sequences and consolidation opportunities within the constraints you already have.
Ready to move beyond manual route planning? Our route optimisation service helps logistics operators implement AI-powered solutions that deliver measurable cost reductions. Combined with our AI readiness assessment, we can identify the biggest opportunities in your current operations and create a practical implementation roadmap.
The ROI Is Clear
For a fleet of 50+ vehicles, route optimisation typically delivers:
- Payback period: 3-6 months
- Annual savings: $200,000-$600,000 (depending on fleet size and current efficiency)
- Additional capacity: 15-25% more drops without additional vehicles
The question isn't whether route optimisation delivers ROI. It's how much you're leaving on the table by not doing it.
Find out what route optimisation could save your operation →
Want to see how much your current routes are costing you? Contact us for a no-obligation assessment of your logistics operations and discover your potential savings with AI route optimisation.
Zero Footprint
The Zero Footprint team — AI modernisation for Australian logistics.