Labour Productivity Per Square Metre: A Warehouse Guide
A practical look at how mid-market warehouse operators can build their own labour productivity per square metre baseline, where public benchmarks genuinely help, and where AI-assisted scheduling and forecasting can lift output — without relying on invented industry numbers.

What Is Labour Productivity Per Square Metre, And Why Does It Matter?
Labour productivity per square metre is a measure of how much output — orders picked, units moved, pallets processed — a warehouse generates relative to both its workforce hours and its physical footprint. For mid-market operators under cost pressure, it's a useful lens because it forces a joint view of two constraints that are usually managed separately: people and space. If you're only tracking units per labour hour, you can miss the fact that a congested or poorly slotted facility is quietly capping what that labour can achieve, no matter how hard the team works.
It's worth being upfront about something: there is no single, universally agreed industry benchmark for "productivity per square metre" that applies cleanly across warehouse types. A cold chain facility, a parcel sortation hub, and a bulk pallet store have fundamentally different layouts, dwell times, and labour models. Be cautious of any vendor or consultant who hands you a precise cross-industry number and tells you that's your target — those figures are rarely comparable without heavy caveats about facility type, automation level, and SKU profile.
How Do You Actually Measure It In Your Own Facility?
The starting point is internal, not external: establish your own baseline before chasing an outside benchmark. Track total labour hours (direct and indirect), total warehouse floor area in use, and a consistent output measure — order lines, units, or pallets moved — over a defined period, then watch the trend over time rather than fixating on a single snapshot.
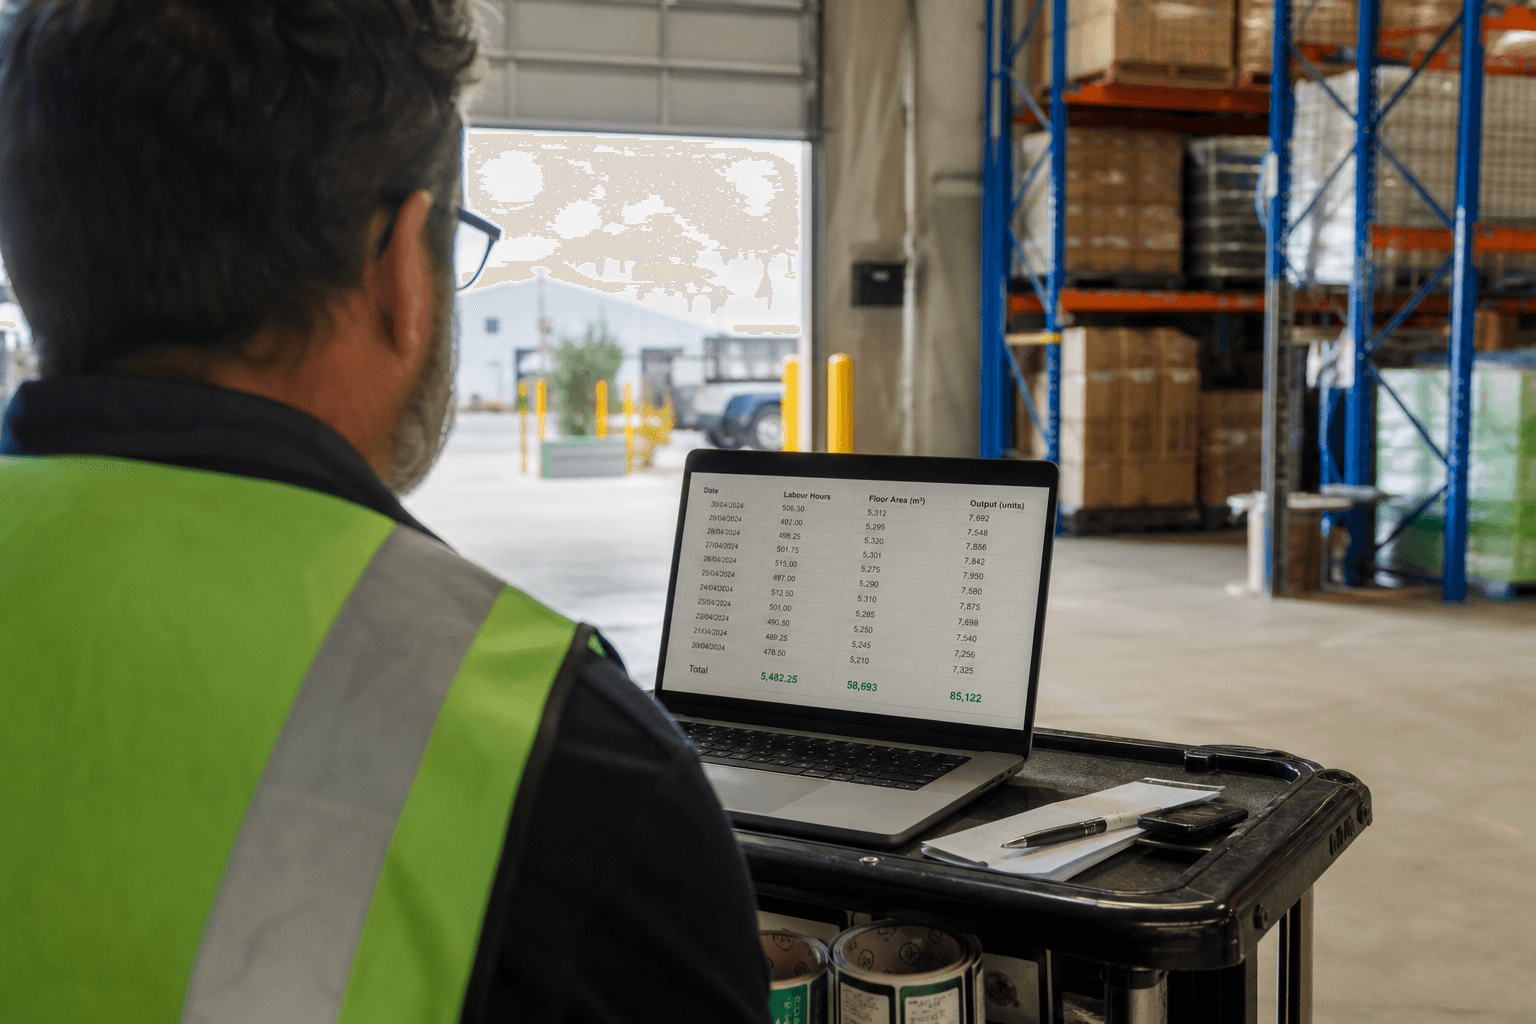
A practical build looks like this:
- Labour hours: rostered hours worked, split by zone or function (receiving, putaway, picking, packing, dispatch).
- Floor area: usable square metres, ideally broken down by storage, pick face, and staging/dock areas, since each behaves differently.
- Output: a stable unit of work — order lines or units shipped — that doesn't shift in definition month to month.
- Time period: consistent reporting windows (weekly or monthly) so seasonal peaks don't distort the trend.
The hard part for most mid-market operators isn't the formula — it's getting clean, reliable numbers out of the systems they already have. Many are running legacy warehouse management systems that weren't built to export this kind of operational data easily, which means the first real step toward benchmarking is often a data readiness exercise, not a new analytics tool.
Where Do Public Benchmarks Fit In?
Public benchmarks are a useful sanity check, not a target to hit exactly. The Australian Bureau of Statistics publishes industry-level labour productivity and multifactor productivity data through its Australian Industry collection, and this can give you a directional sense of how transport, postal and warehousing productivity is trending nationally over time. Industry bodies and logistics associations occasionally run member benchmarking surveys, though coverage and methodology vary and results are rarely broken down to a per-square-metre level specific to your facility type.
Treat any external figure as a reference point for the direction of travel — is national warehousing productivity rising or falling — rather than a precise number to reverse-engineer your own target from. Your own baseline, tracked consistently over 12–24 months, will tell you far more about where you stand than a cross-industry average ever can.
What Role Does AI Actually Play Here?
AI doesn't measure productivity for you — it helps you act on the gaps once you can see them. The two most defensible applications for mid-market warehouses are workforce scheduling and demand forecasting, both of which affect the labour side of the equation directly.
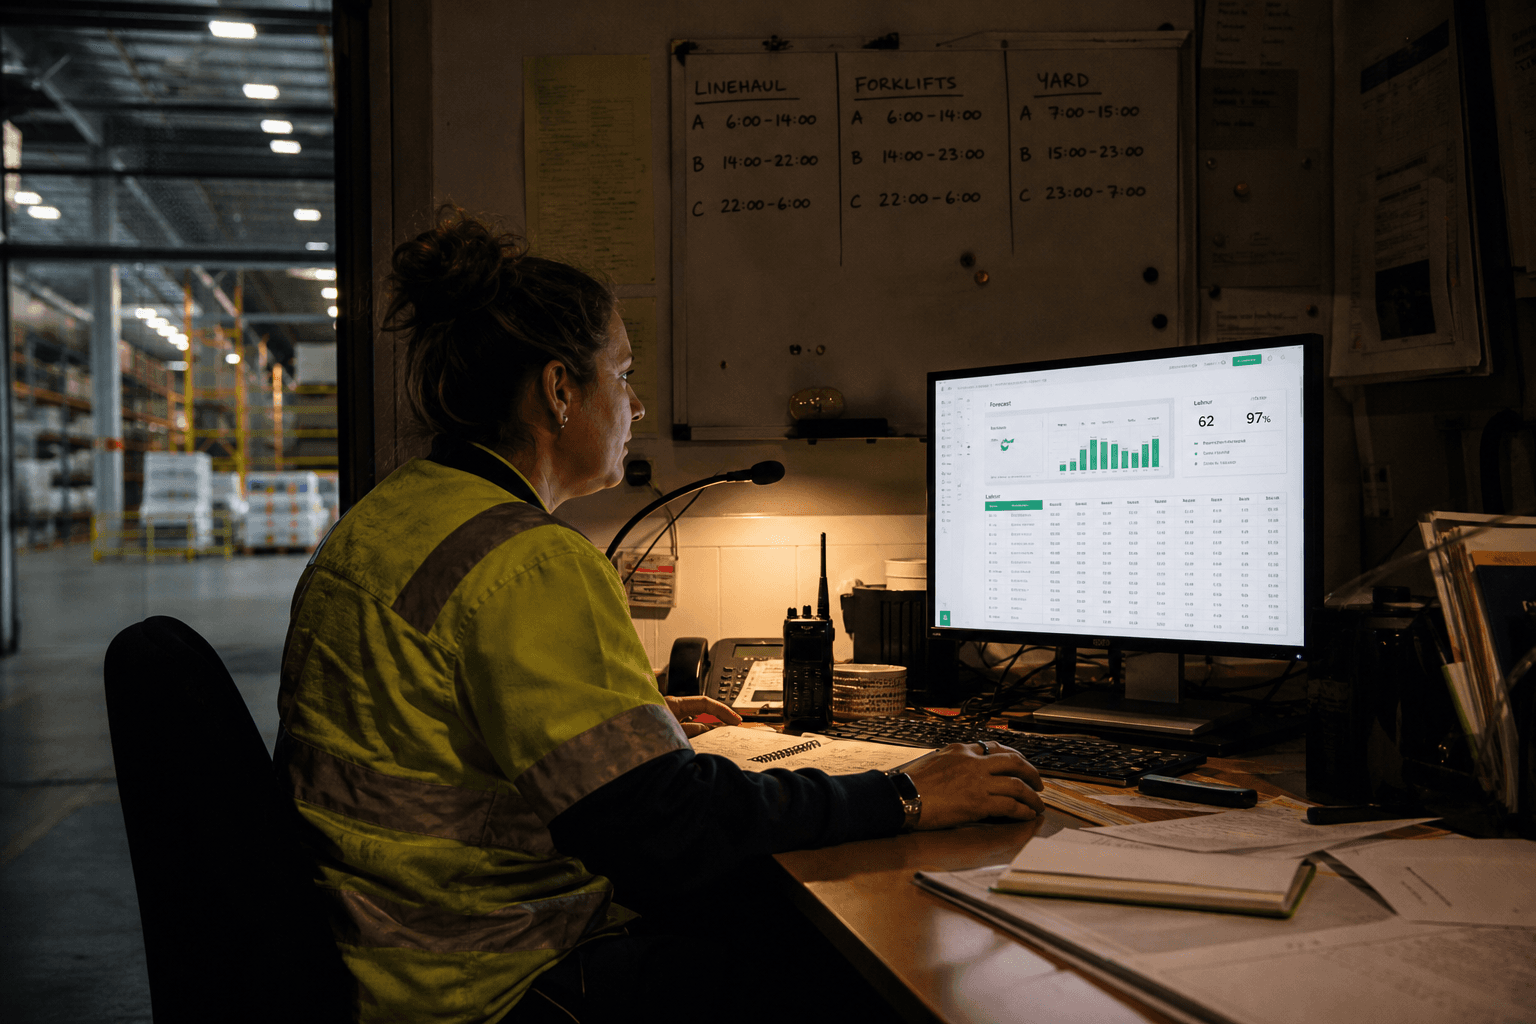
Workforce scheduling automation matches staffing levels to predicted demand more precisely, which reduces the overtime and idle time that distort your per-square-metre numbers in either direction. Demand forecasting models, applied to order history, seasonality, and external signals, improve both inventory positioning and labour planning — so you're not over-rostering during quiet periods or scrambling during peaks. Neither of these requires a warehouse-specific "per square metre" product; they're general productivity levers that happen to show up clearly in this metric once you're tracking it.
What AI won't do is fix a fundamentally inefficient floor layout or a facility that's simply too small for its throughput. If your baseline shows flat or declining output per square metre despite labour investment, the answer might be a layout or slotting review before it's a technology one.
Manual Tracking vs AI-Assisted Monitoring: A Realistic Comparison
| Factor | Manual / spreadsheet tracking | AI-assisted monitoring |
|---|---|---|
| Data freshness | Typically weekly or monthly, after manual collation | Can approach near real-time, depending on WMS integration |
| Effort to maintain | Higher ongoing manual effort | Higher upfront setup, lower ongoing effort |
| Ability to detect patterns (e.g. zone-level bottlenecks) | Limited — relies on analyst time | Higher — pattern detection across more variables |
| Dependence on clean source data | High | Higher still — poor data quality undermines AI outputs faster |
| Suitability for small operations | Often sufficient | May not justify the investment below a certain scale |
The honest takeaway from this comparison is that AI-assisted monitoring amplifies whatever data discipline you already have. It won't compensate for inconsistent definitions of "output" or incomplete floor-area records — it will just surface those problems faster.
What Should You Do Before Investing In Any Benchmarking Tool?
Start by confirming your existing systems can produce trustworthy labour and output data — this is the single most common blocker for mid-market operators attempting any form of productivity benchmarking. If your TMS or WMS can't reliably export hours-by-zone and units-by-period, a sophisticated analytics layer on top will only produce sophisticated-looking noise.
An independent review of your current data and systems is usually a more valuable first investment than a benchmarking platform. That's effectively what an ai-readiness-assessment is designed to establish — whether your existing data is fit for the kind of analysis you're trying to run, and where the gaps are before you commit budget to a bigger build. Once that foundation is solid, targeted levers like workforce scheduling automation or demand forecasting become far more straightforward to justify and measure.
If document-heavy processes — receiving paperwork, dispatch dockets, compliance records — are part of what's slowing your data collection down, it's also worth looking at where document-intelligence could remove manual re-keying that's currently eating into the labour hours you're trying to measure in the first place.
For more on how productivity levers apply across logistics operations more broadly, see our insights.
Final Word
Labour productivity per square metre is a genuinely useful internal metric, but it works best as a trend you track against your own baseline rather than a number you benchmark against an industry-wide figure that may not reflect your facility type. Get your data foundations right first; the AI-assisted levers — scheduling, forecasting — are only as good as what they're built on.
If you're trying to get a clearer picture of labour and space efficiency in your own warehouse, we can help assess whether your current systems and data are ready to support that kind of analysis.
Zero Footprint
The Zero Footprint team — AI modernisation for Australian logistics.