Predictive Maintenance for Fleets: The Business Case
Reactive maintenance costs 3-5x more than preventive. Predictive maintenance uses your existing telematics data to flag issues before trucks break down. Here's the business case.
The Cost of a Breakdown
When a truck breaks down on the Hume Highway at 2am, the direct repair cost is the smallest part of the bill. Add tow truck charges, overnight accommodation for the driver, a replacement vehicle, late delivery penalties, and the customer relationship damage from a missed delivery window.

For a typical interstate linehaul breakdown, the total cost — direct and indirect — runs $5,000-$15,000 per incident. For a metro delivery vehicle, it's $2,000-$5,000 including the cascade effect on other deliveries that day.
Most fleets experience 8-15 unplanned breakdowns per 100 vehicles per year. For a 200-vehicle fleet, that's 16-30 incidents annually, costing $80,000-$300,000 — and that's before counting the reputational damage.
Preventive vs Predictive
Preventive maintenance replaces components on a fixed schedule: oil change every 15,000 km, brake inspection every 6 months, tyres every 80,000 km. It's better than reactive (waiting for things to break), but it's wasteful — you're replacing parts that still have life in them, and you're not catching the failures that don't follow a schedule.
Predictive maintenance uses real-time data from your vehicles to forecast when specific components are likely to fail. Instead of "change the oil every 15,000 km," it's "this vehicle's oil degradation rate suggests a change at 18,200 km" or "this engine's vibration pattern matches early bearing wear — schedule inspection within 2 weeks."
What Data You Already Have
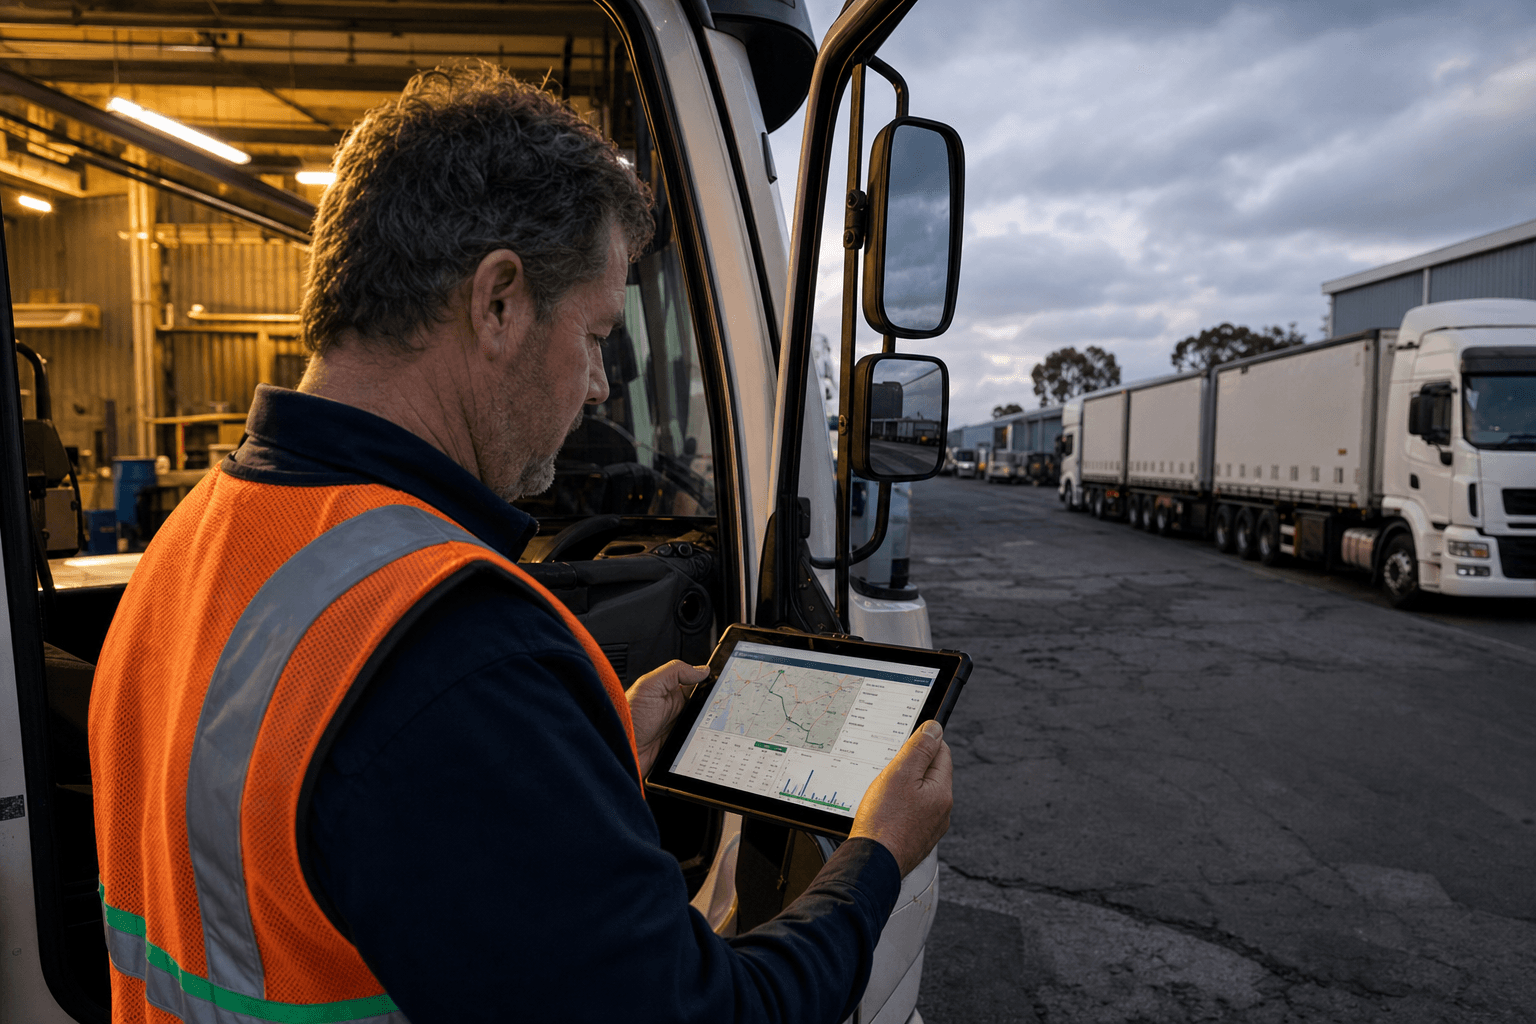
If your fleet has telematics (and most Australian fleets with 50+ vehicles do), you're already generating the data predictive maintenance needs:
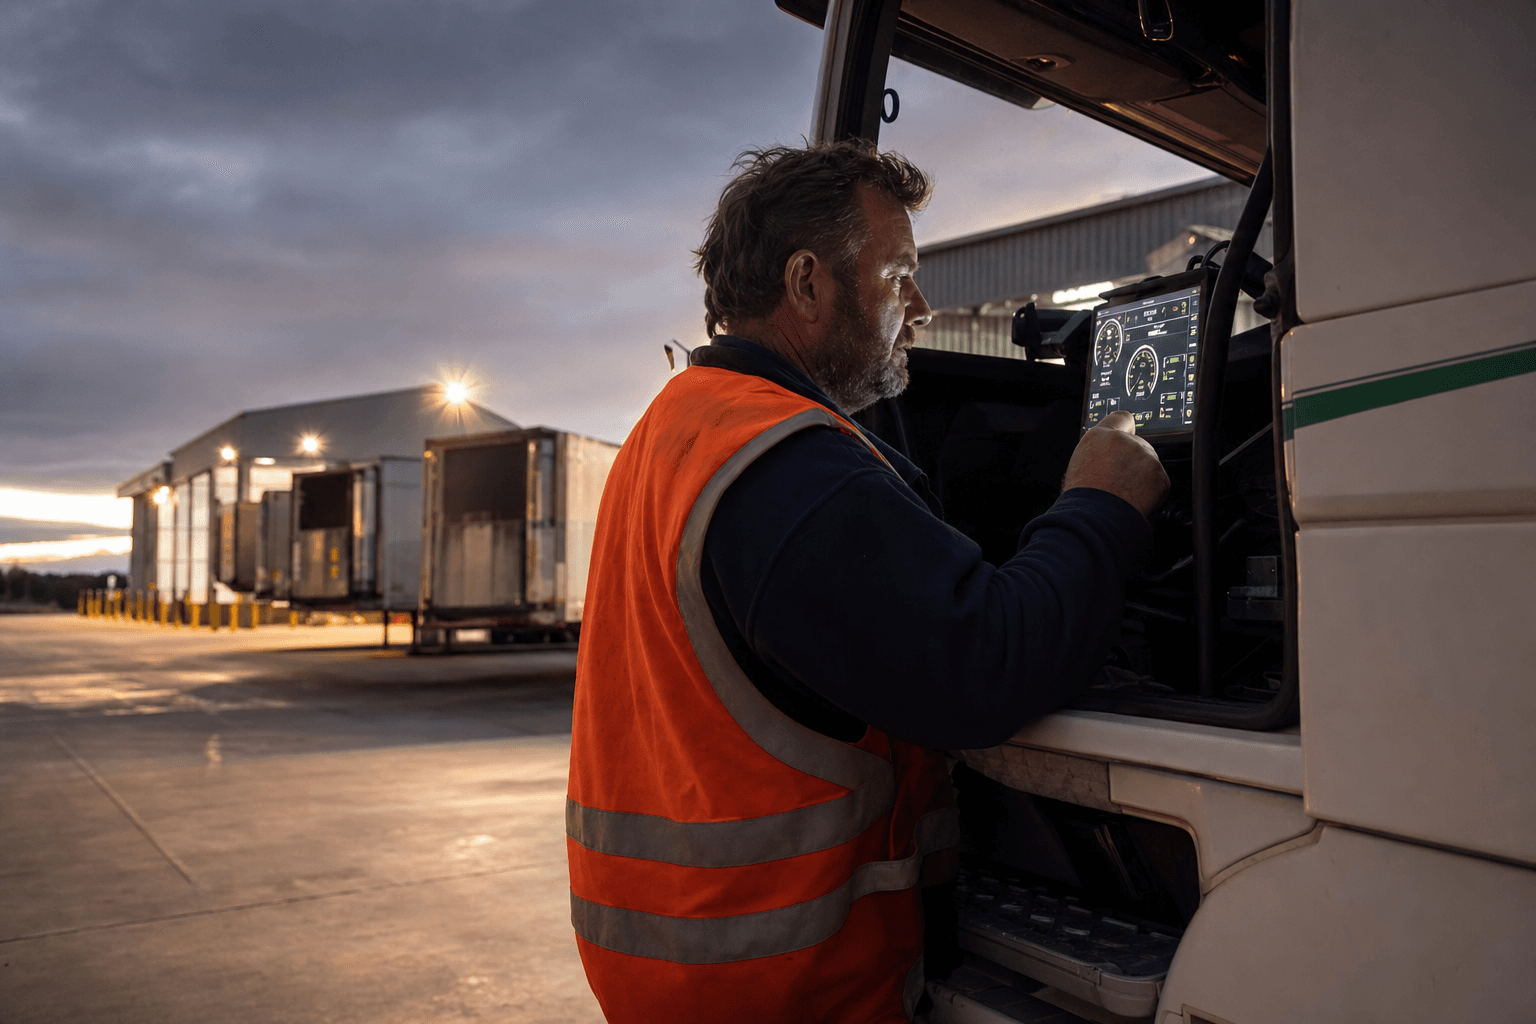
- Engine diagnostics (CAN bus data): RPM patterns, coolant temperature, oil pressure, fuel consumption, fault codes
- GPS/motion data: Harsh braking, rapid acceleration, idle time, route characteristics
- Fuel card data: Consumption trends per vehicle (declining fuel efficiency signals engine issues)
- Maintenance history: Past repairs, parts replaced, workshop notes
Most fleets collect this data but only use it for two things: tracking vehicle location and generating compliance reports. The predictive maintenance opportunity sits in the data you're already paying to collect but not analysing.
How It Works
Pattern Recognition
The system establishes a baseline for each vehicle: normal engine temperature range, typical fuel consumption for its route profile, expected vibration patterns. When a vehicle starts deviating from its baseline, the system flags it.
Failure Prediction
Using historical maintenance data across your fleet (and industry data where available), the system correlates deviation patterns with specific failure modes. "Gradually increasing coolant temperature + slight fuel efficiency decline = radiator degradation, likely failure within 4-6 weeks."
Maintenance Scheduling
Predicted issues are prioritised by urgency and scheduled during planned downtime — depot stays, driver changeovers, or scheduled service intervals. The breakdown that would have happened on the Hume at 2am becomes a planned repair on Tuesday morning at the depot.
The Numbers
| Metric | Reactive | Preventive | Predictive |
|---|---|---|---|
| Cost per maintenance event | $3,000-$8,000 | $800-$2,000 | $600-$1,500 |
| Unplanned downtime (days/vehicle/year) | 12-20 | 5-8 | 2-4 |
| Parts waste (premature replacement) | Low | High (30-40%) | Low (5-10%) |
| Breakdown frequency | High | Medium | Low (70-80% reduction) |
For a 200-vehicle fleet moving from preventive to predictive maintenance:
- Breakdown reduction: 70-80% fewer unplanned incidents
- Parts cost savings: 15-25% (extending component life to actual wear limits)
- Downtime reduction: 40-60% fewer lost vehicle-days
- Annual savings: $150,000-$400,000
Implementation
Phase 1: Data Integration (Weeks 1-4)
Connect telematics, maintenance management, and fuel card systems. Establish baseline performance profiles for each vehicle class.
Phase 2: Anomaly Detection (Weeks 5-8)
Deploy algorithms that flag deviations from baseline. Start with high-value components: engine, transmission, brakes, tyres. Each alert goes to your fleet manager with a recommended action and urgency level.
Phase 3: Failure Prediction (Weeks 9-16)
As the system accumulates your fleet's specific failure history, predictions get more specific and accurate. Move from "something is wrong with this engine" to "this turbocharger has 3-4 weeks of remaining useful life."
Ongoing
The system improves continuously as it sees more data. Accuracy typically reaches 85%+ after 6 months of operation.
Implementing predictive maintenance requires integrating your telematics data with AI-powered analytics systems. Our AI readiness assessment helps evaluate your current data infrastructure and identify opportunities for predictive maintenance implementation. For fleets looking to modernise legacy systems to support predictive analytics, our legacy modernisation services can bridge the gap between existing maintenance systems and modern AI-driven solutions.
Getting Started
You don't need to instrument your fleet with new sensors. If you have telematics and a maintenance management system, you have enough data to start. The investment is in connecting those data sources and building the prediction layer — not in new hardware.
For most fleets, the ROI is clear within the first quarter: fewer breakdowns, lower parts costs, and better vehicle availability. The drivers notice first — they stop getting stranded. The CFO notices second — the unplanned maintenance budget shrinks.
Assess your fleet's predictive maintenance opportunity →
Ready to reduce your fleet's breakdown costs and move from reactive to predictive maintenance? Contact our team to discuss how AI-powered predictive maintenance can transform your fleet operations and deliver measurable cost savings. Get in touch to start building your business case.
Zero Footprint
The Zero Footprint team — AI modernisation for Australian logistics.